

最もよく使われる棒グラフですが、その中でもいくつか使い分けが必要です。そのいくつかの種類の棒グラフの描き方を紹介します。
データの準備
まずはデータの準備をします。デモ用のデータとして最もよく使われるiris(アヤメ)データセットを今回も使います。
# 作業ディレクトリ
setwd("~/Rpractice/")

# tidyverseの起動
library(tidyverse)

#irisデータをaに格納
a <- iris

#データの確認
> head(a)
  Sepal.Length Sepal.Width Petal.Length Petal.Width Species
1          5.1         3.5          1.4         0.2  setosa
2          4.9         3.0          1.4         0.2  setosa
3          4.7         3.2          1.3         0.2  setosa
4          4.6         3.1          1.5         0.2  setosa
5          5.0         3.6          1.4         0.2  setosa
6          5.4         3.9          1.7         0.4  setosa
>
それではこのirisデータを用いていくつかの棒グラフをつくっていきます。
棒グラフはgeom_bar()を使う
それではgeom_bar()を使っていきます。まずはアヤメデータの先頭にあるSepal.Lengthの値を使っていきます。
横軸にアヤメの種類(Species)、縦軸にSepal.Lengthをとります。値をy軸に取るときにはgeom_bar(stat = “identity”)とidentityを指定します。その他にはcountとbinを取ることが出来ます。
ggplot(a, aes(Species, Sepal.Length))+
  geom_bar(stat = "identity")
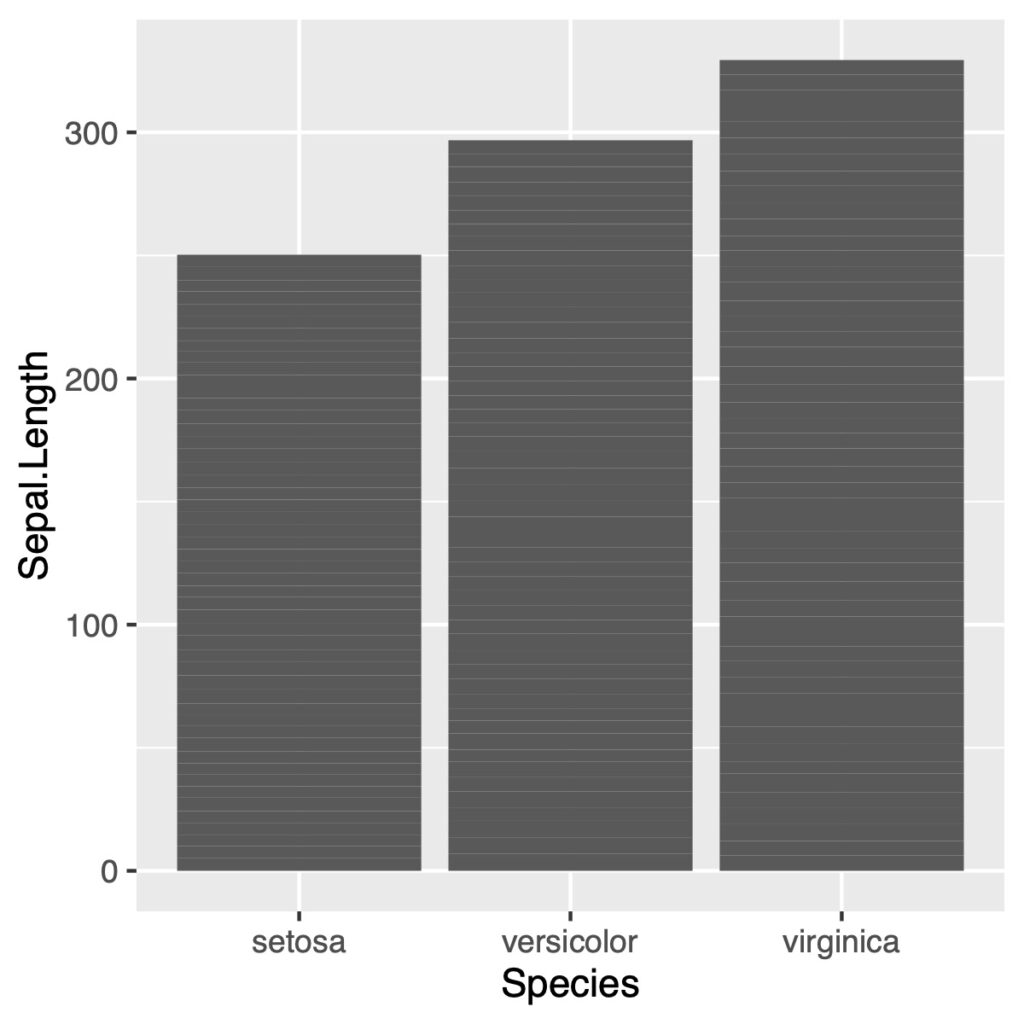
グラフを作成したら何が縦軸の値をとっているのか、しっかり確認することが必要です。元のデータと対比し、自分の出したい値が作図されているか確認しましょう。上の例では積み上げになっています。
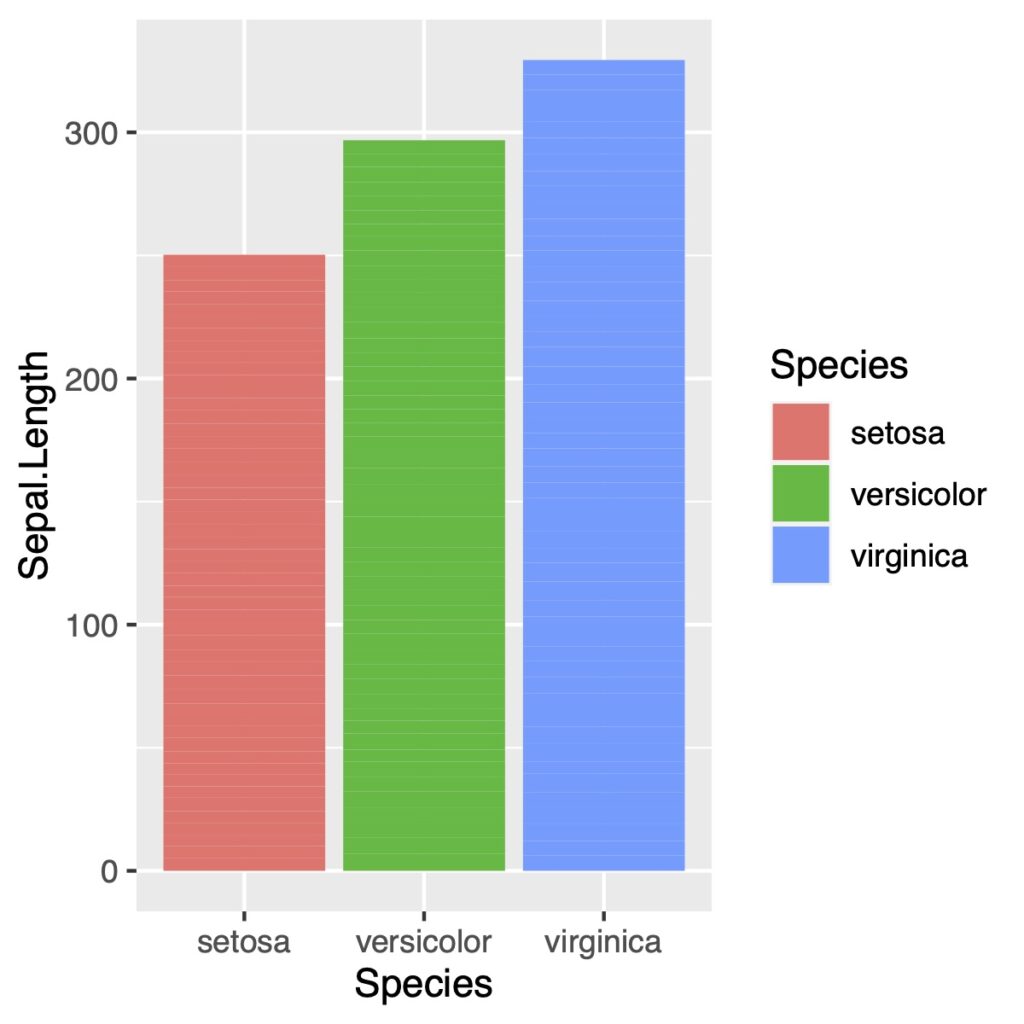
色を付ける
塗りつぶしにはaesの中でfillを指定します。枠の色を指定したいときはcolourで指定します
ggplot(a, aes(Species, Sepal.Length, fill = Species))+
  geom_bar(stat = "identity")
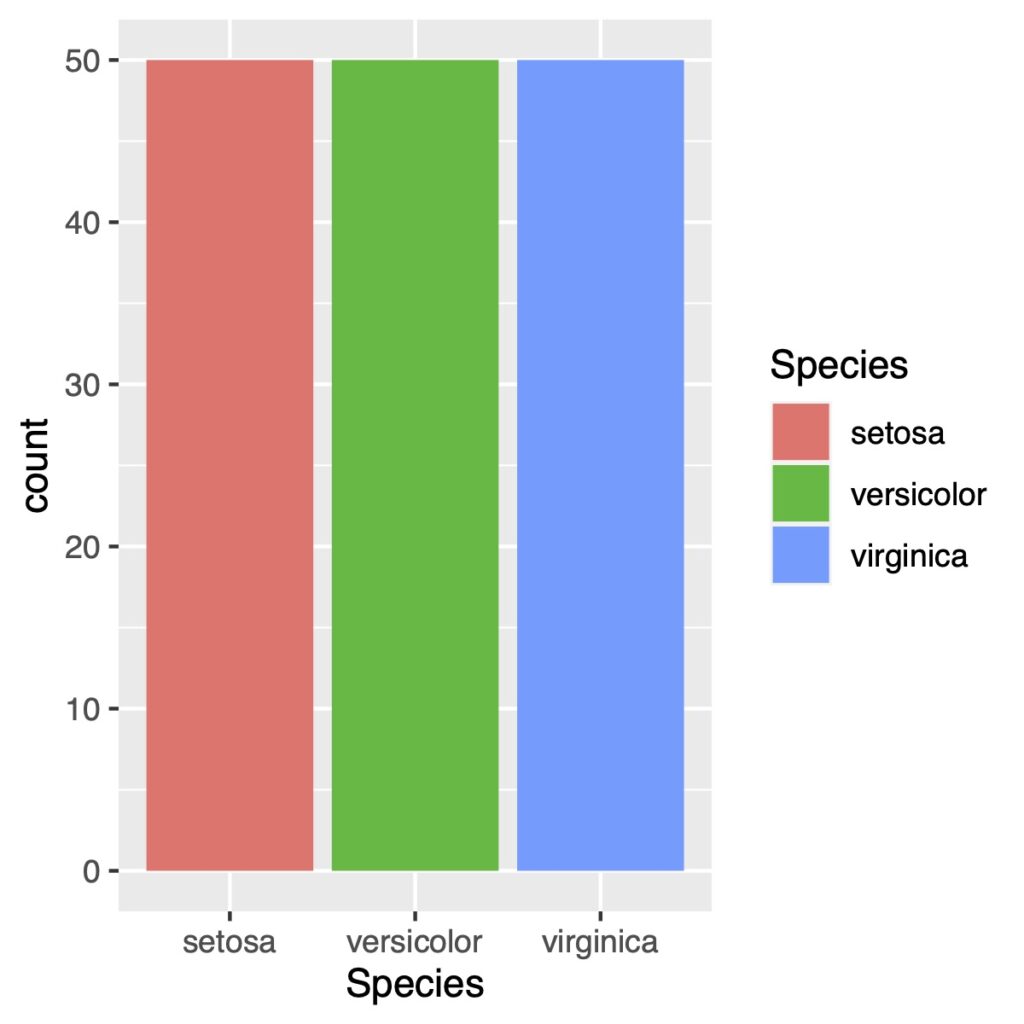
個数を出したいときはgeom_bar(stat = “count”)と指定します。
ggplot(a, aes(x = Species, fill = Species))+
  geom_bar(stat = "count")
グループ化された棒グラフを作図する
まず最初に平均値を計算します。合わせて、SDやSEも計算をしておくとエラーバーを付け加えることができます。
# 縦長のグラフ
a.long <- pivot_longer(a, col = Sepal.Length:Petal.Width,
                         names_to = "iris.attr",
                       values_to = "measures")

# グループごとの平均値などの計算
a.sum <- group_by(a.long, iris.attr, Species) %>%
  summarize_all(list(mean = mean,
                     max = max,
                     sd = sd,
                     se = ~sd/sqrt(length(.))))
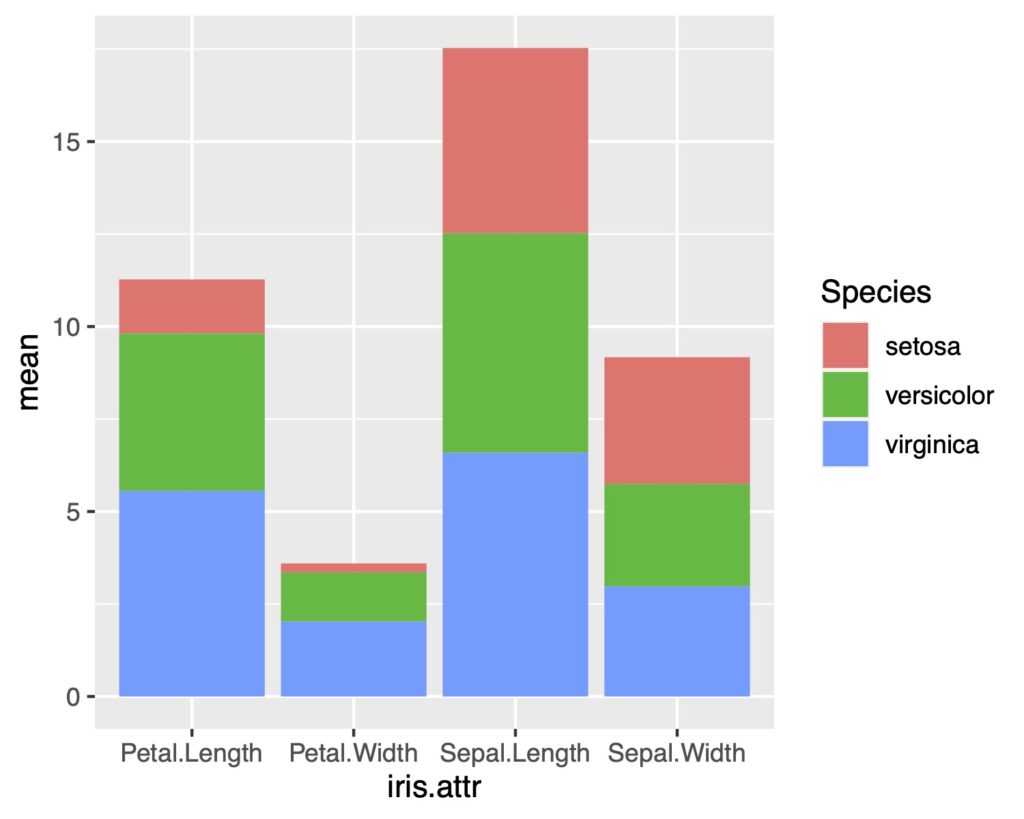
積み上げ棒グラフ
geom_barでpositionを指定しなければ積み上げ棒グラフになります。
ggplot(a.sum, aes(x = iris.attr, y = mean, fill = Species))+
  geom_bar(stat = "identity")
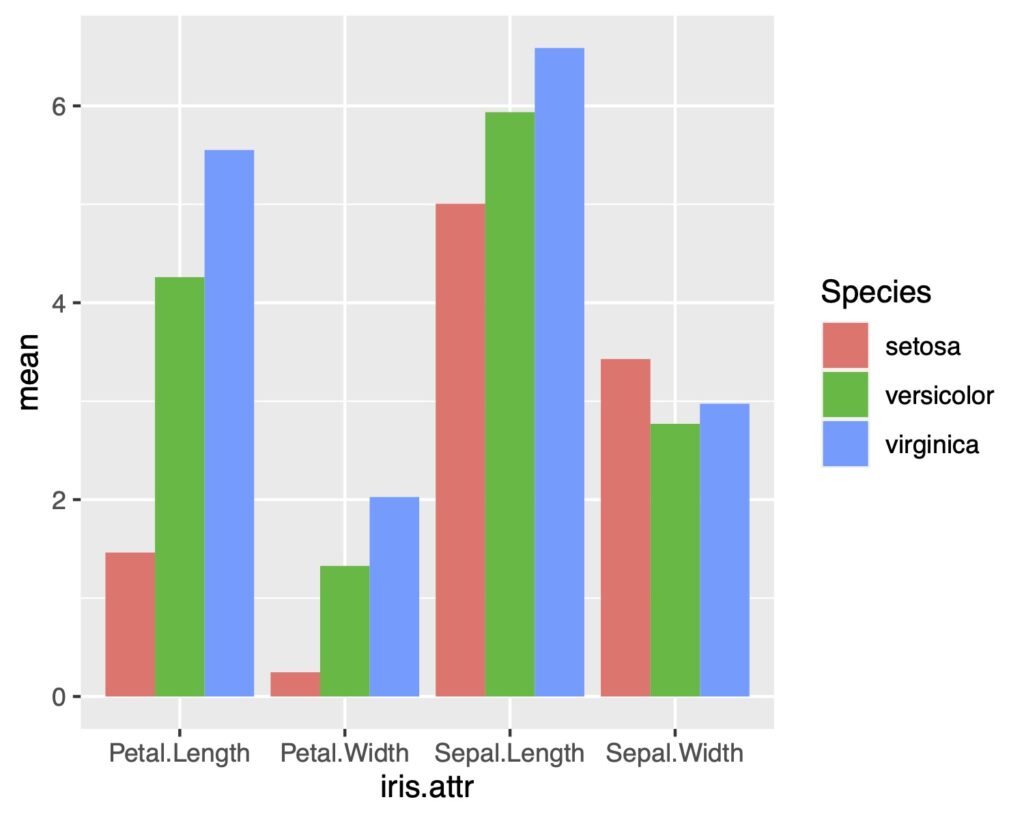
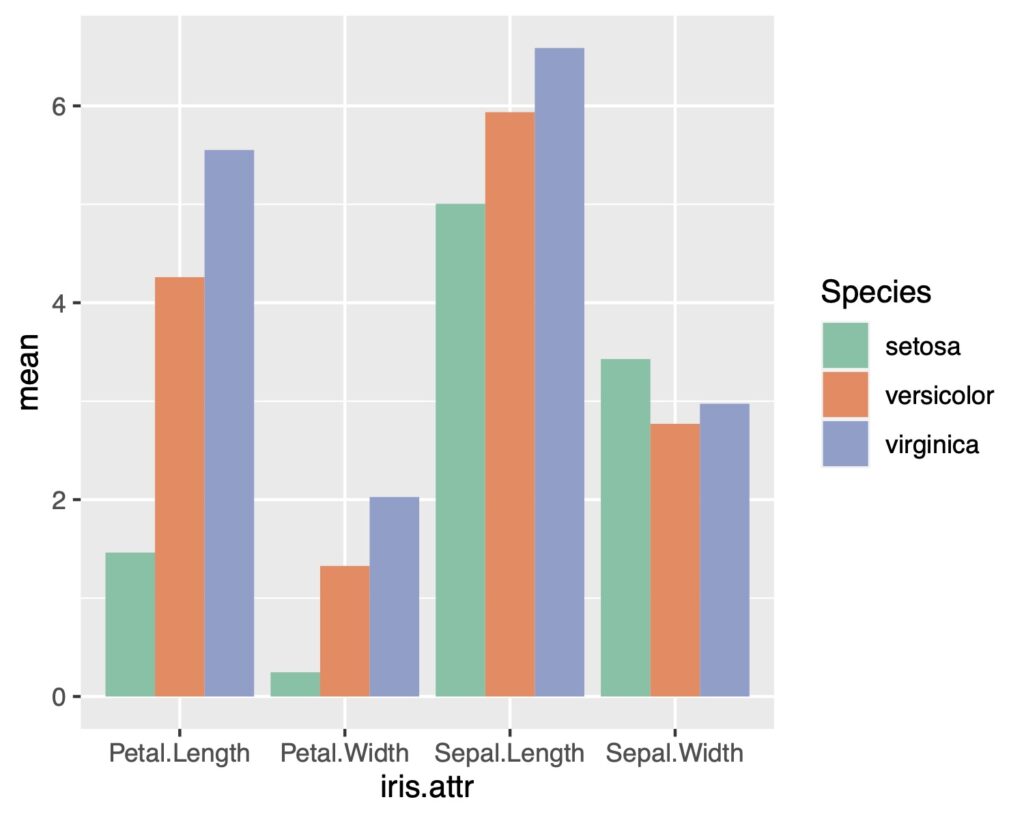
グループ別の棒グラフ
それぞれグループを横に並べた棒グラフはgeom_barでposition = “dodge”と指定します。
ggplot(a.sum, aes(x = iris.attr, y = mean, fill = Species))+
  geom_bar(stat = "identity", position = "dodge")
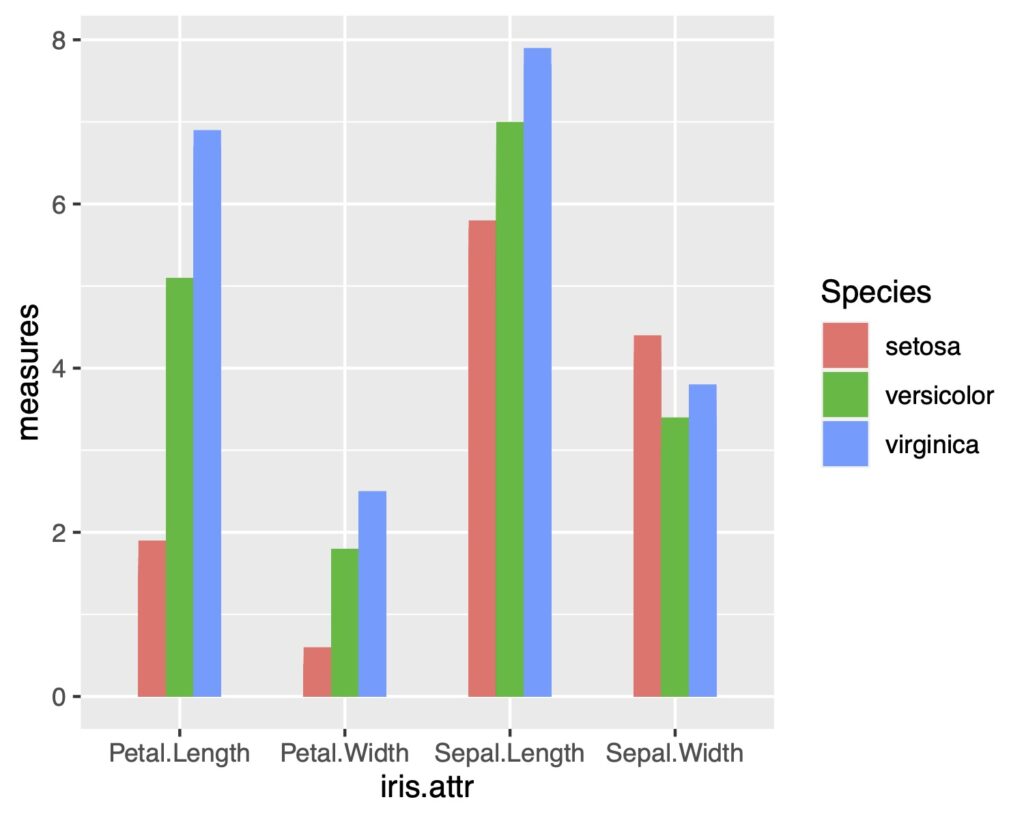
幅を調整する
横幅についてはwidthで調整をします。width = 0.5にしてみます。
ggplot(a.long, aes(x = iris.attr, y =measures, fill = Species))+
  geom_bar(stat = "identity", position = "dodge" , width = 0.5)
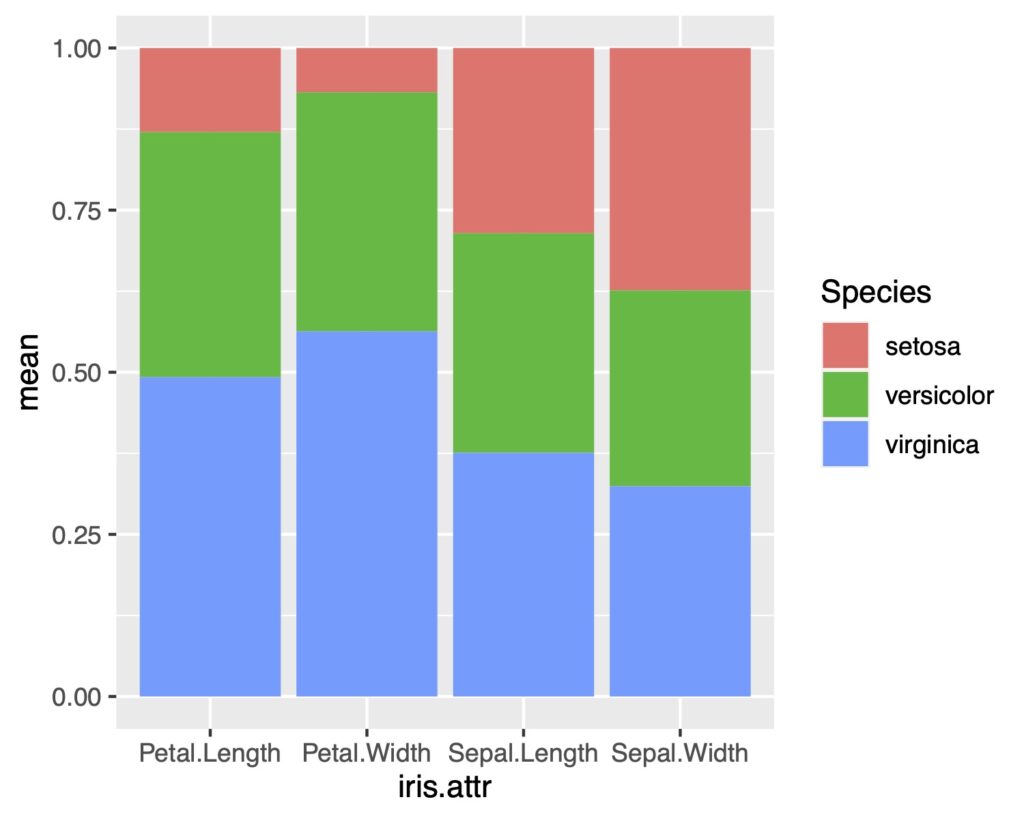
100%積み上げ棒グラフ
実際の数値ではなく、割合で比較したい時に有用です。
geom_bar(position = “fill”)とすることで100%積み上げ棒グラフを作図できます。
ggplot(a.sum, aes(x = iris.attr, y = mean, fill = Species))+
  geom_bar(stat = "identity", position = "fill")
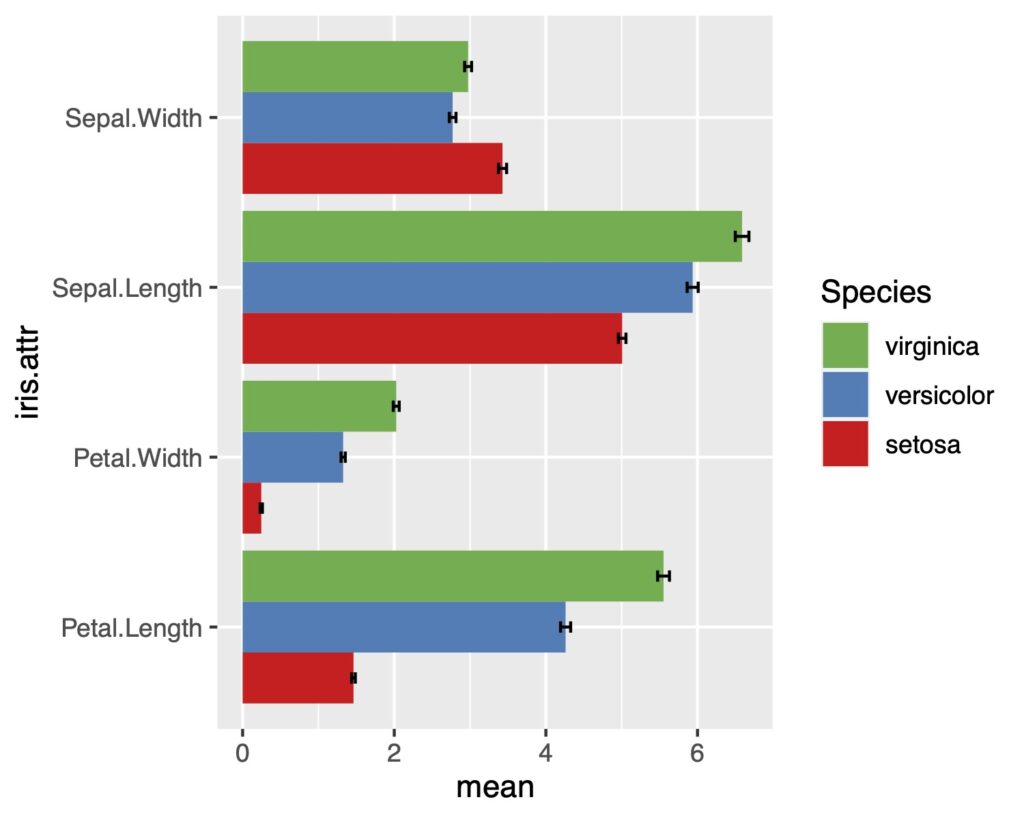
横向き棒グラフ
横向きにするときにはcood_flip()を追加します。
ggplot(a.sum, aes(x = iris.attr, y =mean, fill = Species))+
  geom_bar(stat = "identity", position = "dodge") +
  coord_flip()

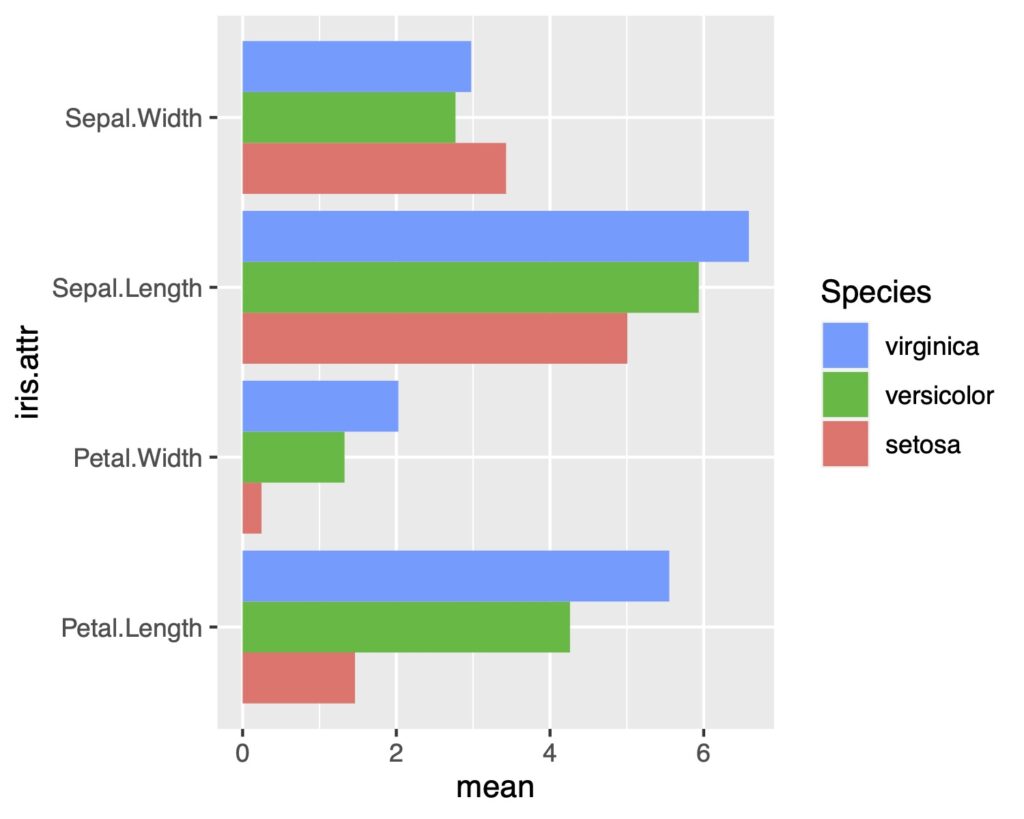
凡例の順番を入れ替える
棒グラフの並びと凡例の並びが合わないときにはguides(fill = guide_legend(reverse = TRUE))を指定します。
ggplot(a.sum, aes(x = iris.attr, y =mean, fill = Species))+
  geom_bar(stat = "identity", position = "dodge") +
  coord_flip()+
  guides(fill = guide_legend(reverse = TRUE))
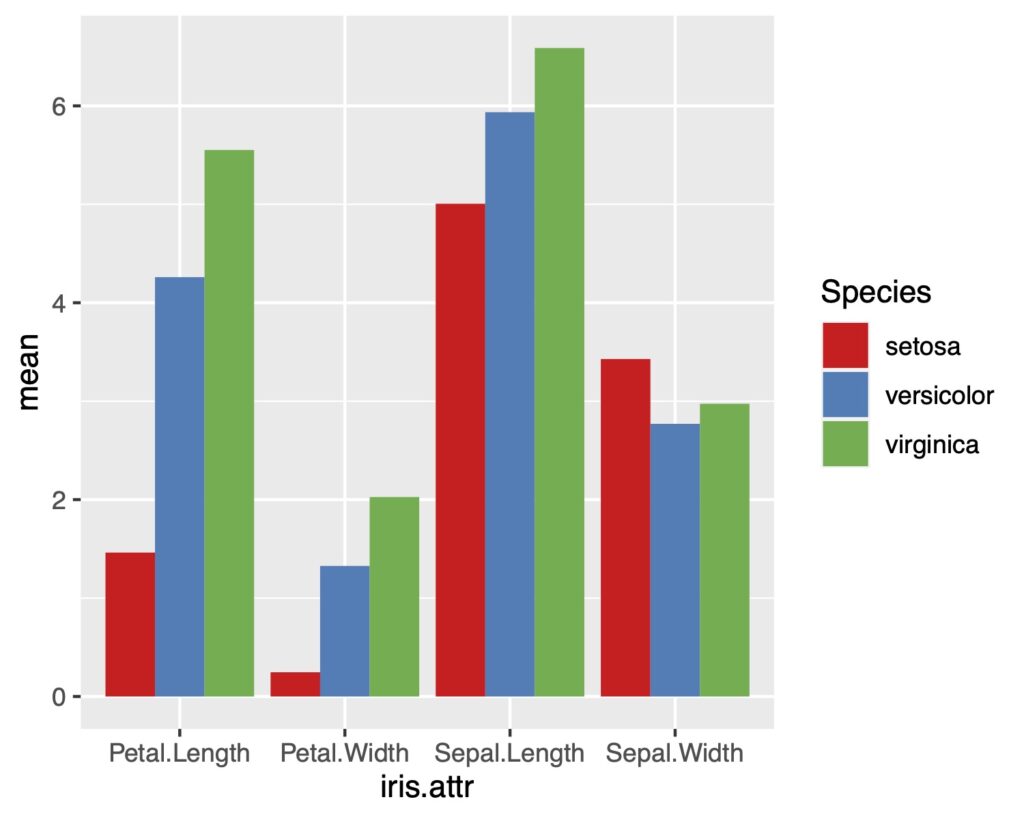
色を変える
色を変える方法は色々とありますが、scale_fill_brewerで簡単にセット化されたものを使ってみます。
scale_fill_brewer(palette = “Set1”)と指定します。
ggplot(a.sum, aes(x = iris.attr, y = mean, fill = Species))+
  geom_bar(stat = "identity", position = "dodge" , width = 0.9)+
  scale_fill_brewer(palette = "Set1")
さらにscale_fill_brewer(palette = “Set2”)で色を変えてみます。
ggplot(a.sum, aes(x = iris.attr, y = mean, fill = Species))+
  geom_bar(stat = "identity", position = "dodge" , width = 0.9)+
  scale_fill_brewer(palette = "Set2")
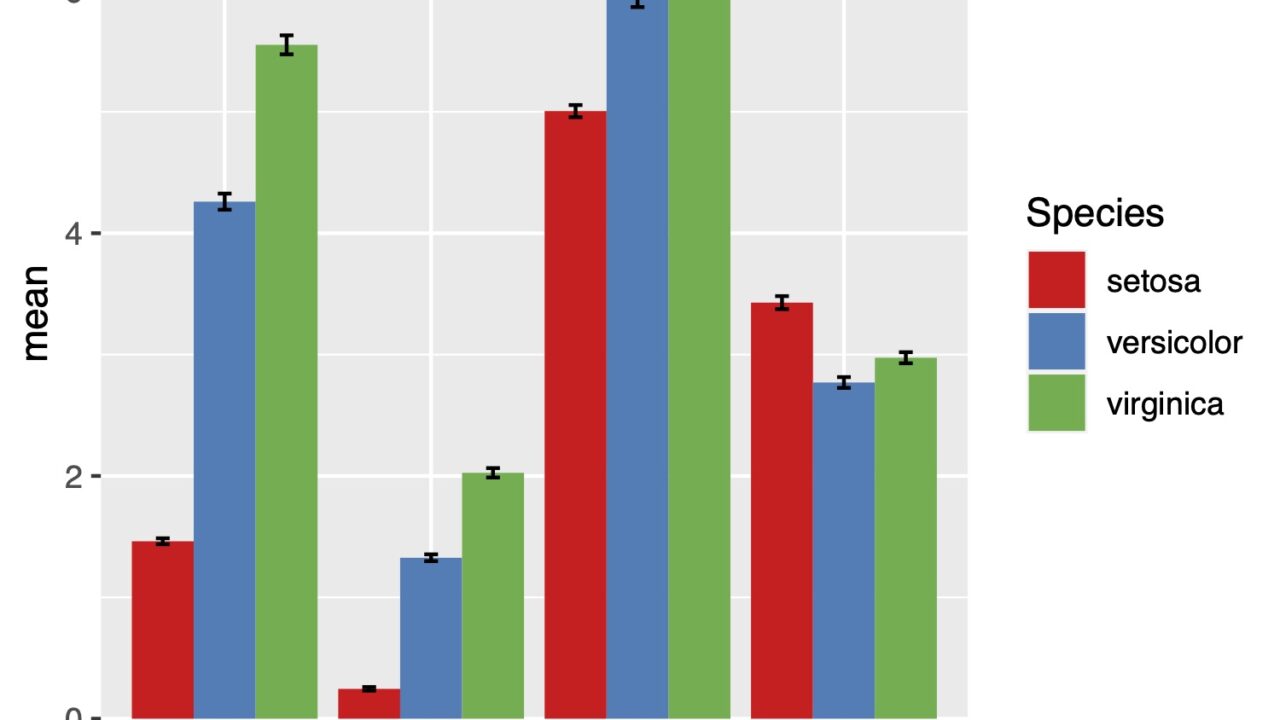
エラーバーをつける
最後にエラーバーをつけます。
エラーバーをの付け方については、次のリンクで詳しく説明をしています。
縦棒グラフ+エラーバー
ggplot(a.sum, aes(x = iris.attr, y = mean, fill = Species))+
  geom_bar(stat = "identity", position = "dodge" , width = 0.9)+
  scale_fill_brewer(palette = "Set1")+
    geom_errorbar(aes(ymin = mean - se, ymax = mean + se),
                  position = position_dodge(0.9), width = .2)

横棒グラフ+エラーバー
ggplot(a.sum, aes(x = iris.attr, y = mean, fill = Species))+
  geom_bar(stat = "identity", position = "dodge" , width = 0.9)+
  scale_fill_brewer(palette = "Set1")+
  geom_errorbar(aes(ymin = mean - se, ymax = mean + se),
                position = position_dodge(0.9), width = .2)+
  guides(fill = guide_legend(reverse = TRUE))+
  coord_flip()
お役に立ちましたら幸いです。