プレゼンテーションや論文に重要な図の作り方です。キレイな図なだけで人の目を引きます!
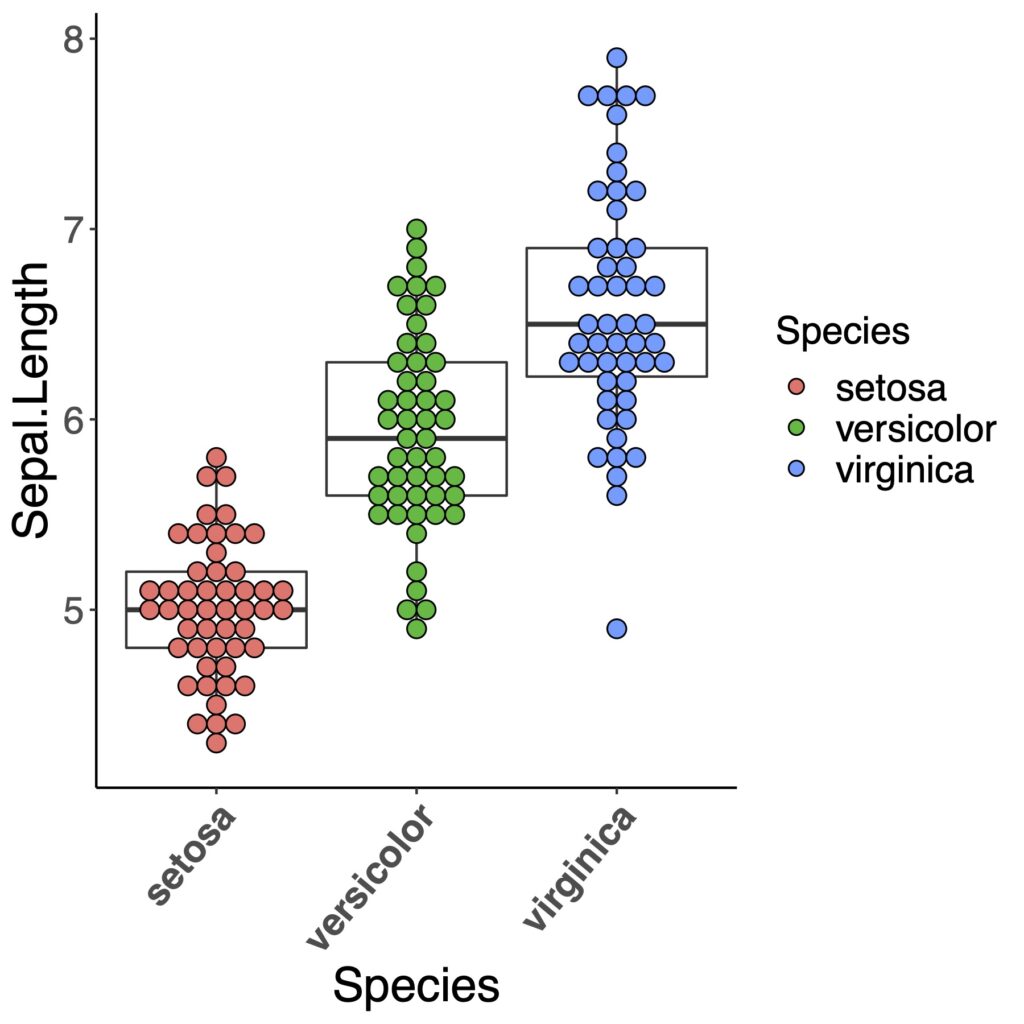
Rではggplot2を使えば「無料」でキレイな図が描けます。この記事では次のような図をできるようになります。
では最初にRStudioを開きます。
検証したRのバージョンです。
R version 4.0.5
データの準備をする
作業ディレクトリをセットする
ディレクトリはフォルダと同じです。Rpracticeというディレクトリをホームに作ります。
setwd("~/Rpractice/")
ggplot2パッケージを入れる
すでに入れてある人はスキップします。
他の有用なパッケージがセットで入っているtidyverseがおすすめです。
install.packages(ggplot2)
または、
install.packages(tidyverse)
次にパッケージを起動します。
> library(tidyverse)
─ Attaching packages ─────────────────── tidyverse 1.3.0 ─
✓ ggplot2 3.3.2     ✓ purrr   0.3.4
✓ tibble  3.0.4     ✓ dplyr   1.0.2
✓ tidyr   1.1.2     ✓ stringr 1.4.0
✓ readr   1.4.0     ✓ forcats 0.5.0
─ Conflicts ──────────────────── tidyverse_conflicts() ─
x dplyr::filter() masks stats::filter()
x dplyr::lag()    masks stats::lag()
>
tidyverseからggplot2を起動しました。
ここでは練習のためアヤメデータを利用します
アヤメとは…
茎の先端に1-3輪の花を咲かせる多年草です
- Sepal Length(がく片の長さ)
- Sepal Width(がく片の幅)
- Petal Length(花びらの長さ)
- Petal Width(花びらの幅)
- Species (アヤメの種類)
のデータが入っています
アヤメデータをaに格納します。
a <- iris
head(a)
headで最初の数行が表示されるので、データの構造がわかります。
> head(a)
  Sepal.Length Sepal.Width Petal.Length Petal.Width Species
1          5.1         3.5          1.4         0.2  setosa
2          4.9         3.0          1.4         0.2  setosa
3          4.7         3.2          1.3         0.2  setosa
4          4.6         3.1          1.5         0.2  setosa
5          5.0         3.6          1.4         0.2  setosa
6          5.4         3.9          1.7         0.4  setosa
>
自分のデータを使う方用にcsvファイルの取り込み方を説明します。
アヤメデータをcsvファイルにします。
write.csv(a, "~/Rpractice/irisdata.csv", row.names=FALSE)
いったんaを削除して、セーブしたcsvファイルから再びaに取り込みます。
a <- read.csv(file="~/Rpractice/irisdata.csv",sep = ",", header=TRUE)
ggplot2でボックスプロットを作る!
準備はできました。ggplot2を使っていきます。
baseのboxplotを使ったボックスプロット
boxplot(Sepal.Length ~ Species, data=a)
ggplot2の中のqplotを使ったボックスプロット
qplot(a$Species, a$Sepal.Length, geom="boxplot")
ggplot2のggplotを使ったボックスプロット
ではggplot2でボックスプロットをつくってみましょう。
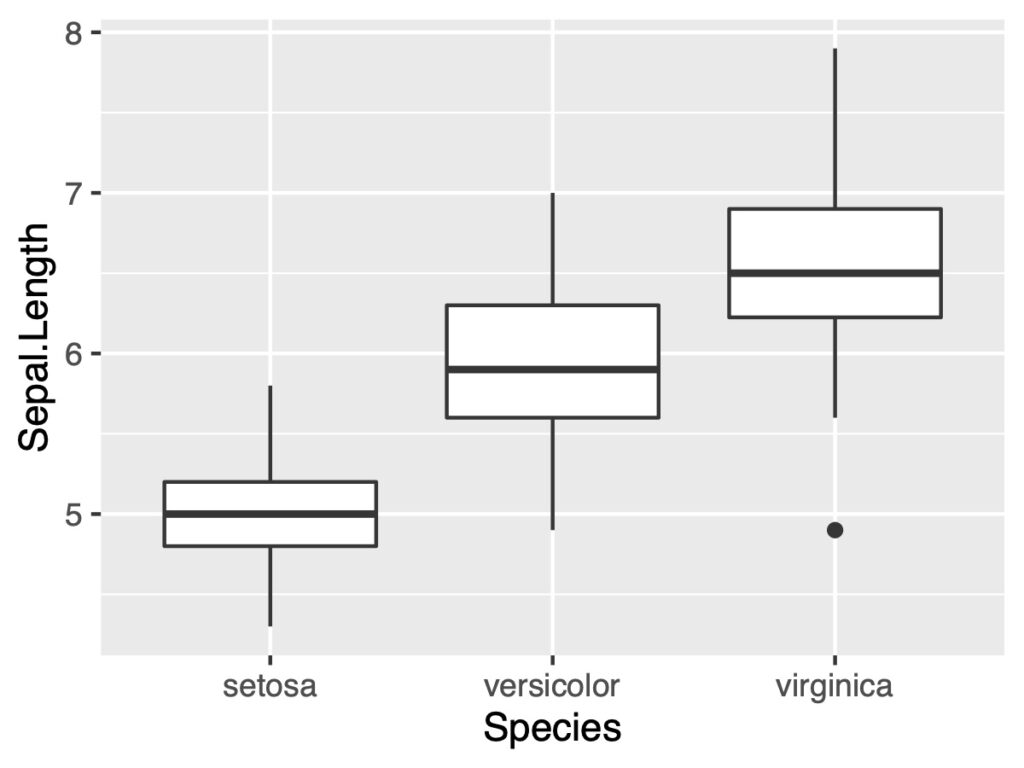
まずはデフォルトです。geom_boxplot()で出来ます。
ggplot(a, aes(x=Species, y=Sepal.Length))+
    geom_boxplot()
widthで幅を設定する
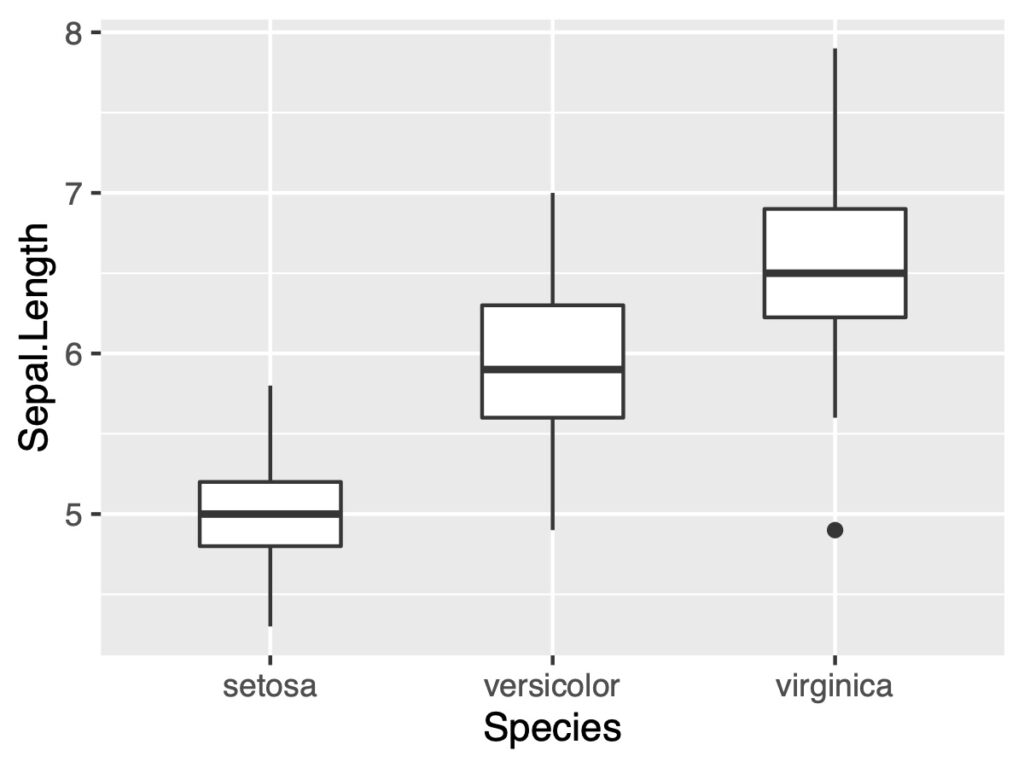
幅が太いと思ったら変更できます。geom_boxplot(width = )で数値を指定します。
ggplot(a, aes(x = Species, y = Sepal.Length))+
    geom_boxplot(width = .5)
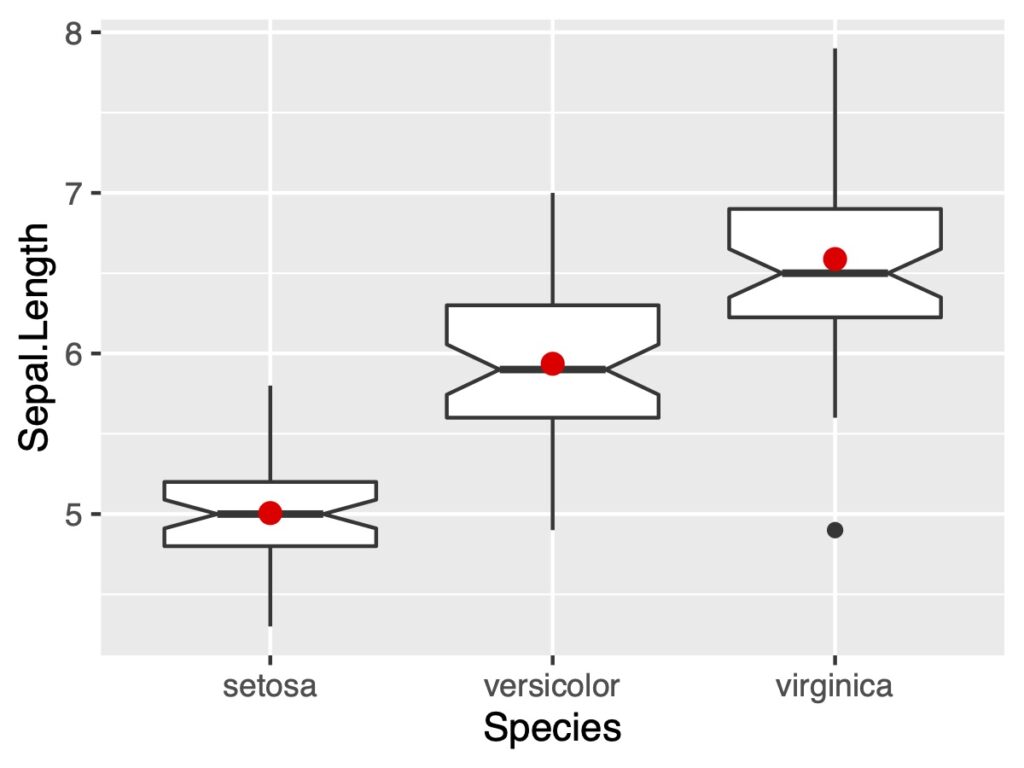
notchでノッチをつける
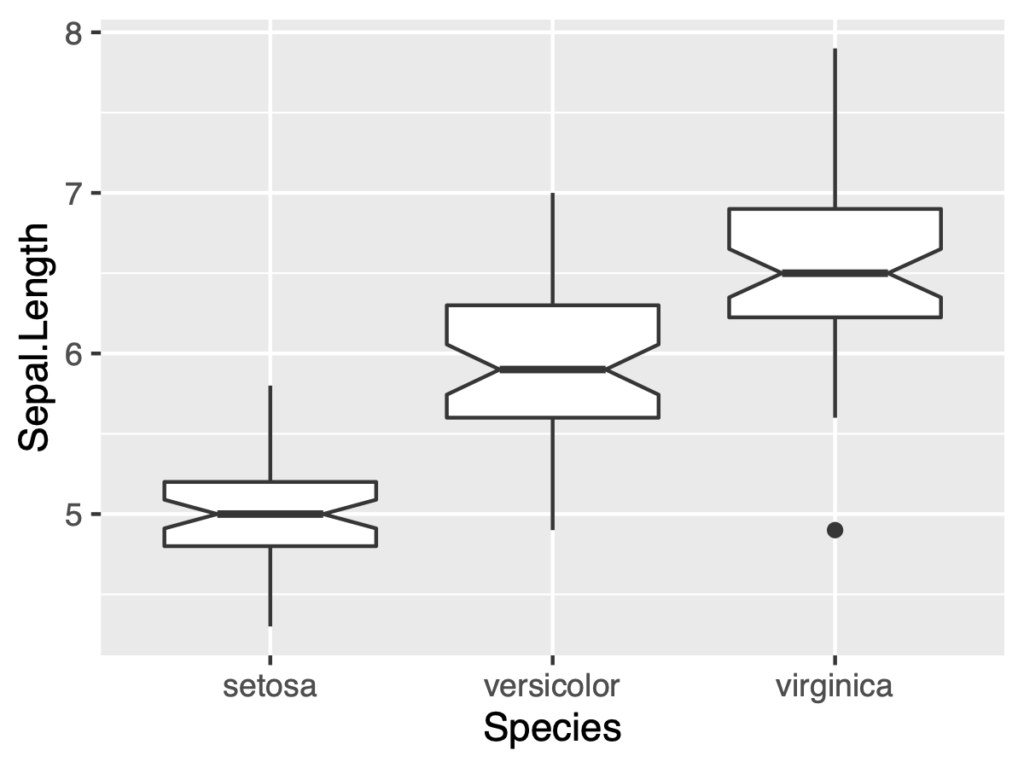
箱ひげ図にノッチを入れることができます。geom_boxplot(notch = TRUE)と指定します。
ggplot(a, aes(x = Species, y = Sepal.Length))+
    geom_boxplot(notch = TRUE)
平均値を入れる
平均値を入れるときはggplot2のstat_summaryを利用します。
finでmeanを指定、また色を赤くしてみます。
geomで形を、sizeでその大きさを指定できます。
ggplot(a, aes(x = Species, y = Sepal.Length))+
    geom_boxplot(notch = TRUE)+
    stat_summary(fun = "mean", ,geom = "point",
                          size = 2.5, color = "red")
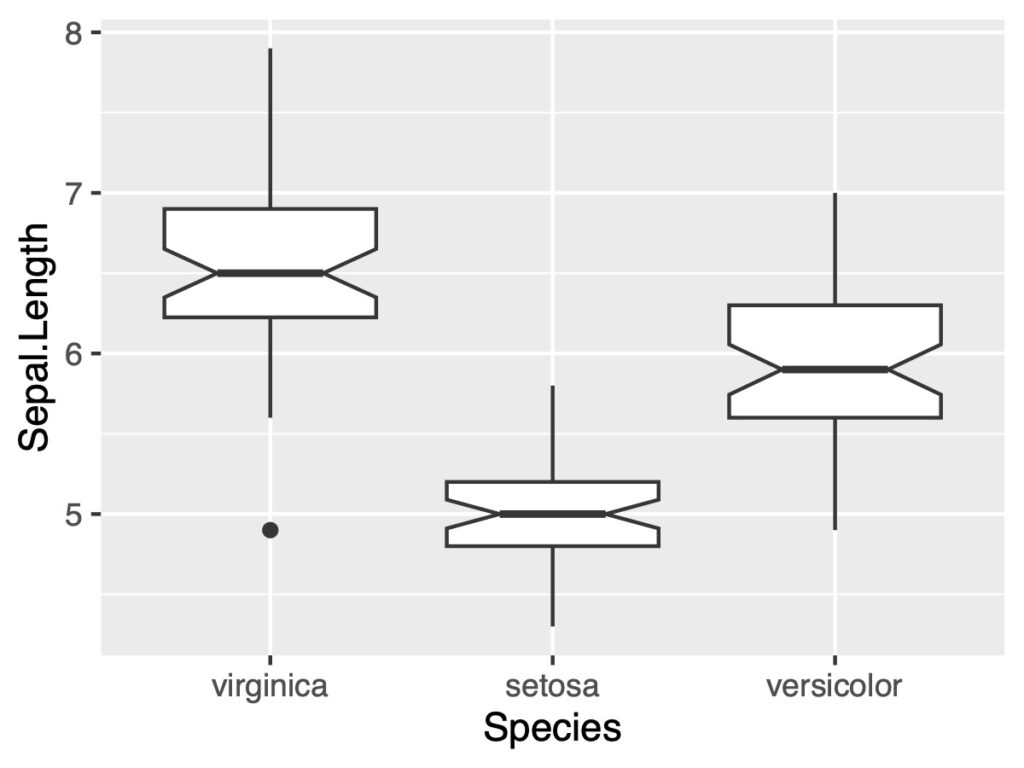
x軸の並びの順番を変える
x軸の並びの順番を変えるには次のようにscale_x_discreteを追加します。
ggplot(a, aes(x=Species, y=Sepal.Length))+
  scale_x_discrete(limit=c('virginica', 'setosa', 'versicolor'))+
  geom_boxplot(notch = TRUE)
箱ひげ図にドットプロットを加える
ドットプロットを追加する
箱ひげ図にドットプロットを追加することができます。geom_dotplot()を使います。
正直なプロットで分布がよくわかるので好きな図です。
ggplot(a, aes(x=Species, y=Sepal.Length))+
    geom_boxplot(notch=TRUE)+
    geom_dotplot(binaxis="y", binwidth=0.1, stackdir="center")
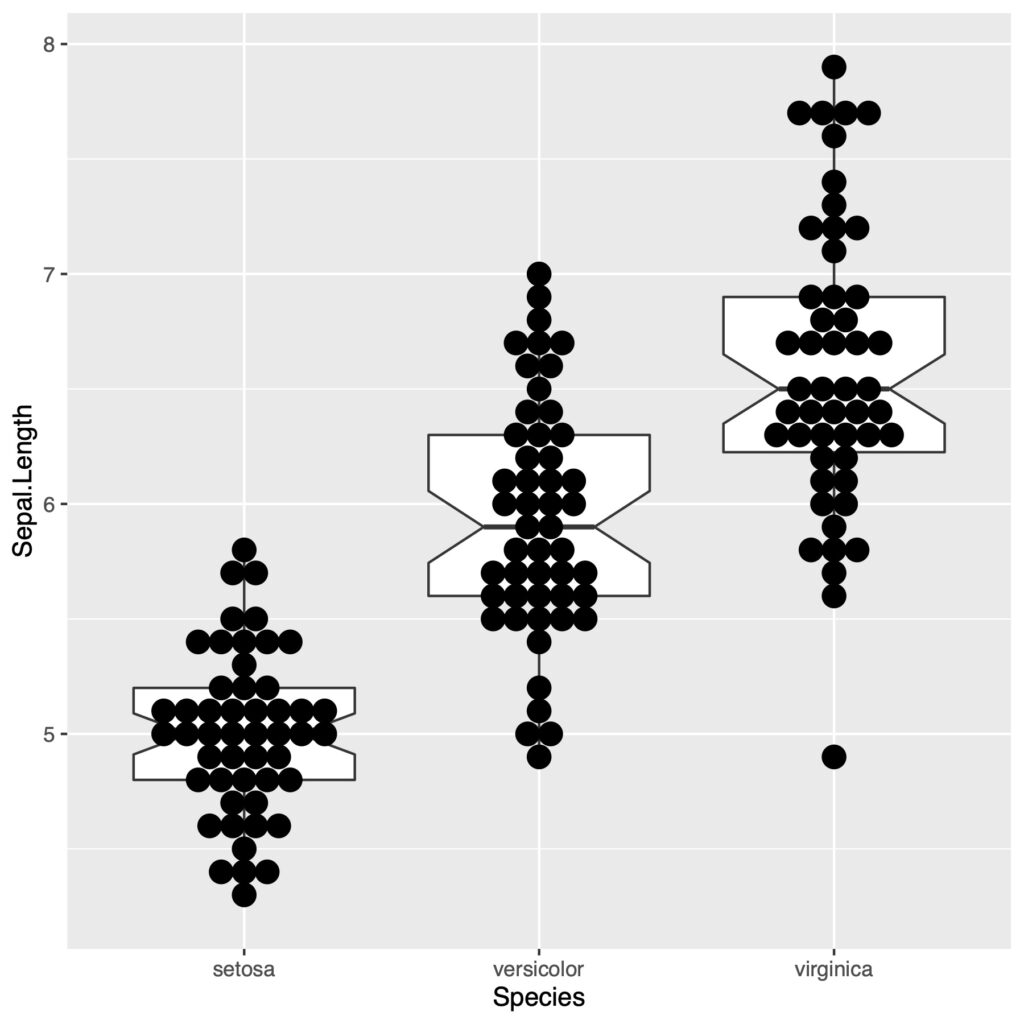
図を保存するときにドットプロットが重なりすぎない高さに調整しました。
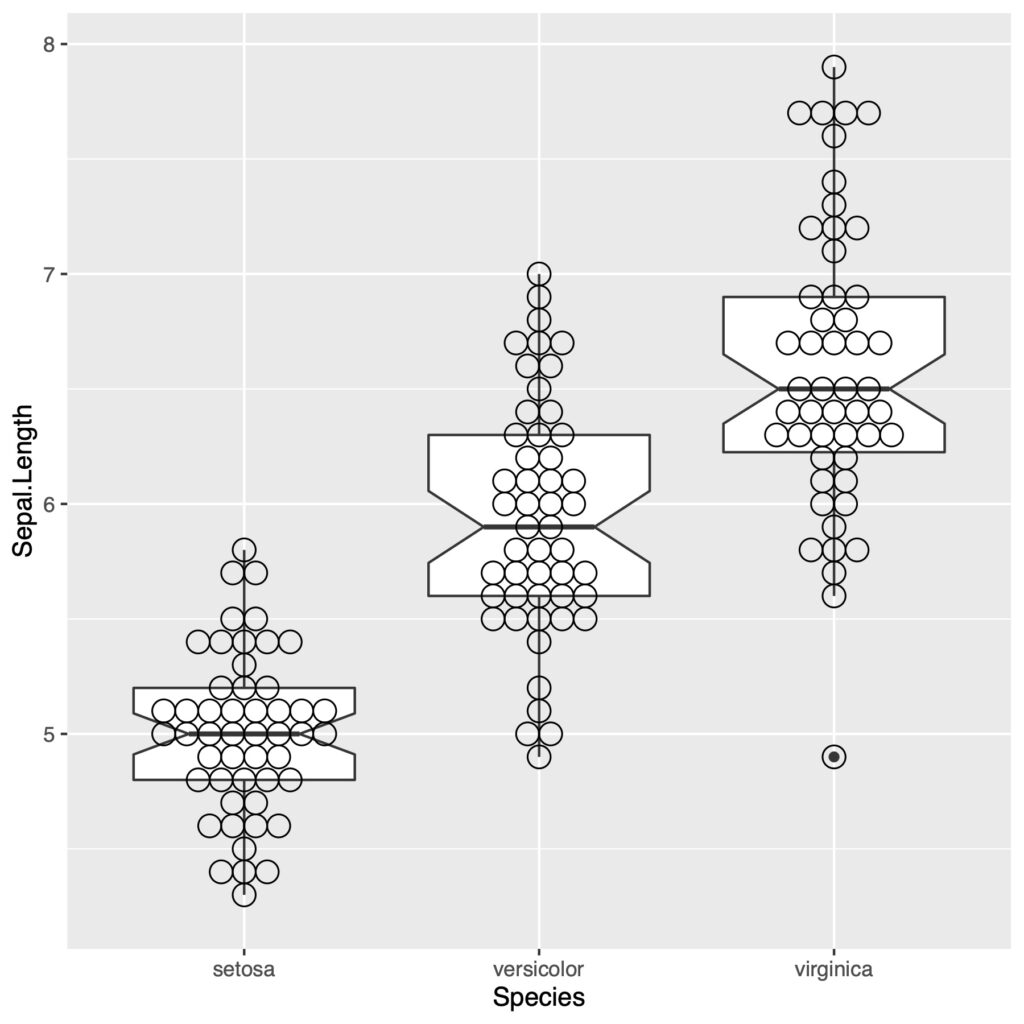
ドットプロットを白抜きにする
点を白抜きにするにはfill = NAにします。
ggplot(a, aes(x = Species, y = Sepal.Length))+
  geom_boxplot(notch = TRUE)+
  geom_dotplot(binaxis = "y", binwidth = .1, stackdir = "center", fill = NA)
もう少し華やかにしたいですね。
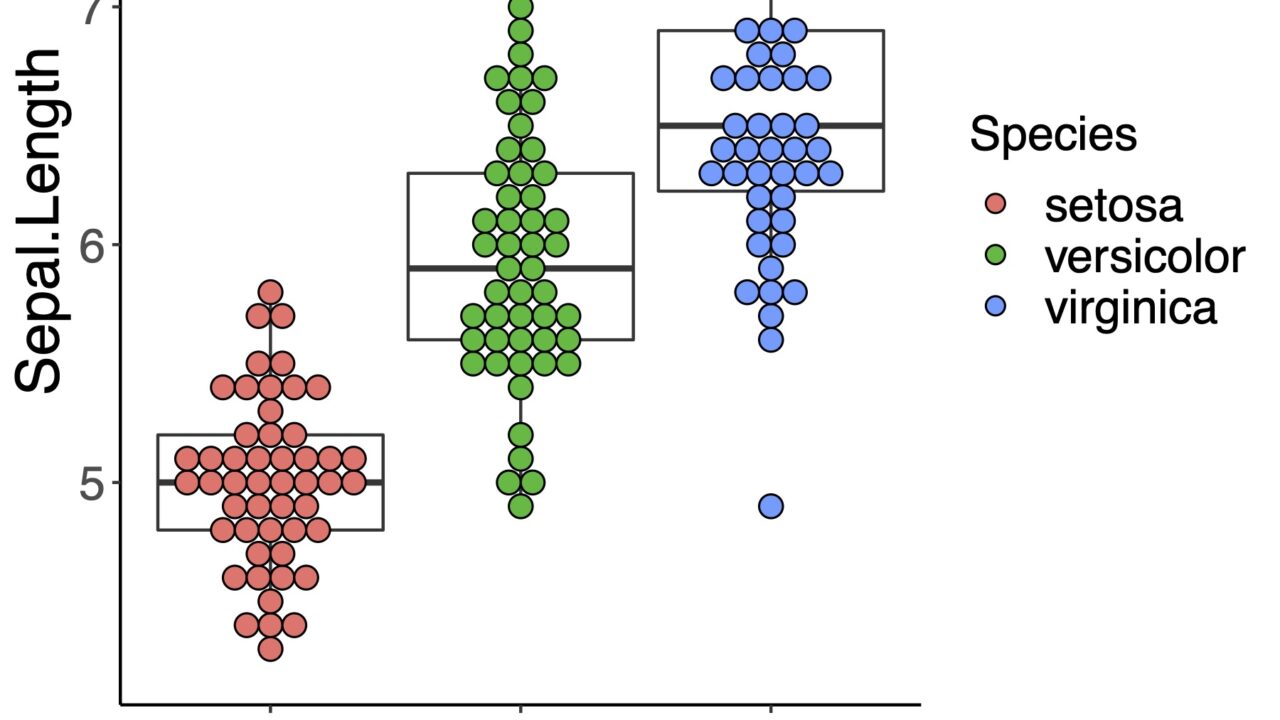
箱ひげ図とドットプロットに色をつける
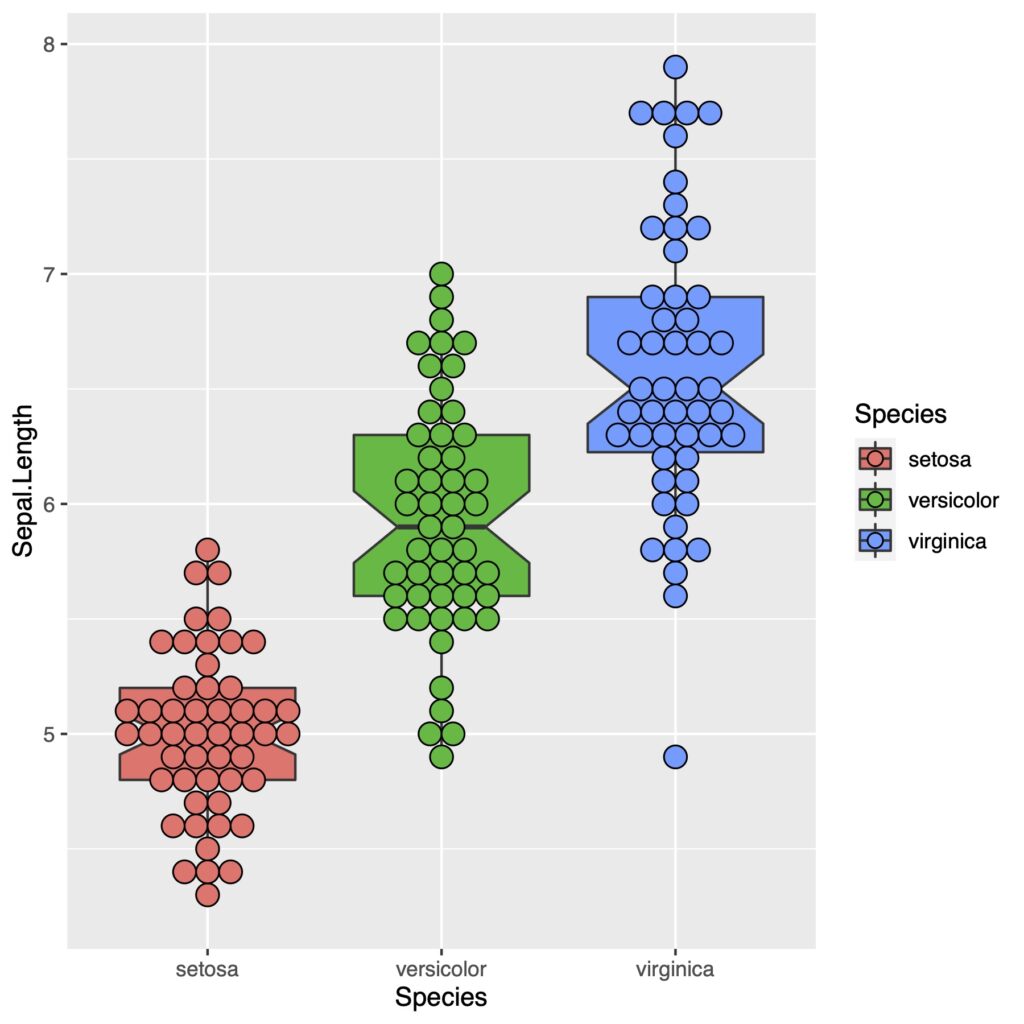
色を付けるにはfill = でカテゴリーを指定します。どの()の中のaesで指定するかによって、どれが色付けされるかが変わります。つまりggplot()の中のfillで指定すればboxplotもdotplotも両方とも色付けされます。
ggplot(a, aes(x=Species, y=Sepal.Length, fill=Species))+
    geom_boxplot(notch=TRUE)+
    geom_dotplot(binaxis="y", binwidth=0.1, stackdir="center")
()
ボックスプロットのみ色を変える
ボックスプロットのみ色をつけるには、geom_boxplot()のfillで色を付けるか、geom_dotplot()のfillでNAを指定します。
ggplot(a, aes(x=Species, y=Sepal.Length, fill=Species))+
    geom_boxplot(notch=TRUE)+
    geom_dotplot(binaxis="y", binwidth=0.1, stackdir="center", fill=NA)
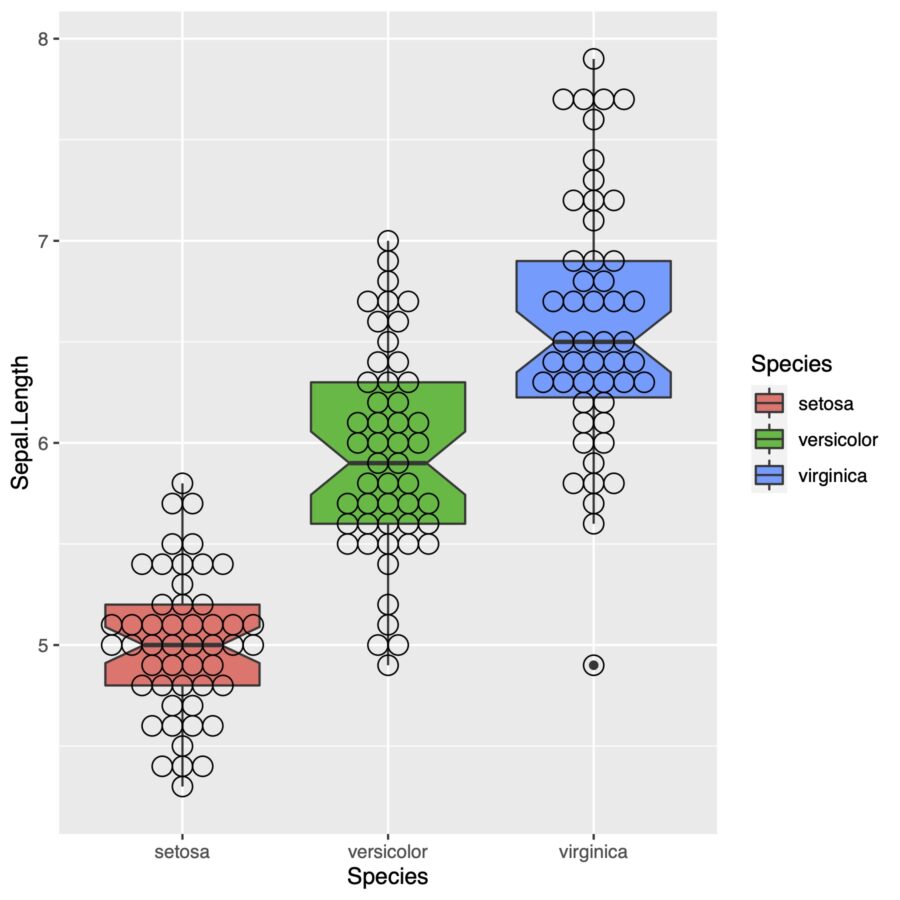
またはこれでも同じです。
ggplot(a, aes(x=Species, y=Sepal.Length))+
  geom_boxplot(aes(fill = Species), notch = TRUE)+
  geom_dotplot(binaxis="y", binwidth=.1, stackdir = "center", fill = NA)
ドットプロットのみに色をつける
ドットプロットのみに色をつけるにはgeom_boxplot()のfillで白を指定するか、geom_dotplot()でfillを指定します。
ggplot(a, aes(x=Species, y=Sepal.Length, fill=Species))+
    geom_boxplot(notch=TRUE, fill="white")+
    geom_dotplot(binaxis="y", binwidth=0.1, stackdir="center")
ggplot(a, aes(x=Species, y=Sepal.Length))+
  geom_boxplot(notch = TRUE)+
  geom_dotplot(aes(fill=Species),
               binaxis="y", binwidth=.1, stackdir = "center")
上の2つはどちらも同じグラフになります。
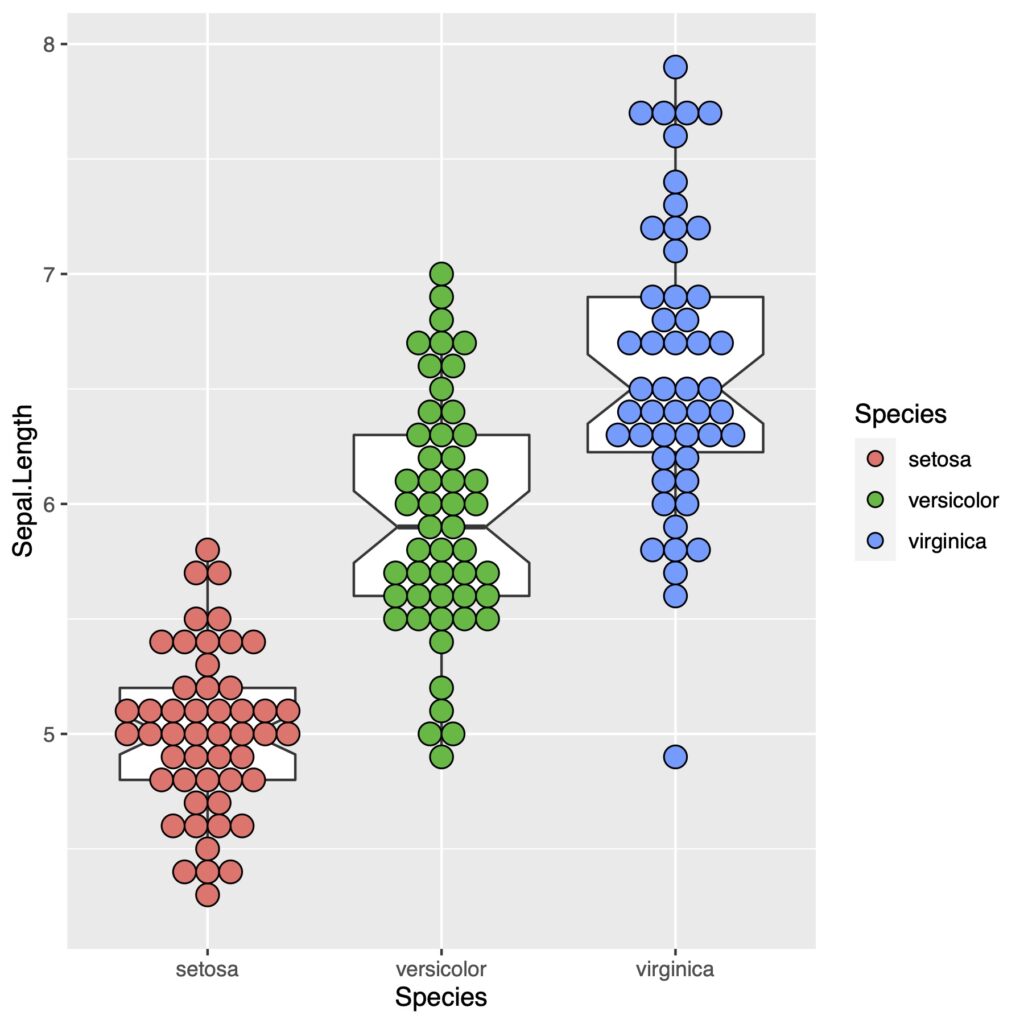
見た目がよくなりました。箱ひげ図より読み取れる情報が直感的にわかりやすくなりました!
アルファでドットプロットの色を半透明にする
半透明にすることで重なりがわかりやすくなります。alpha=で透明度を指定します。
ggplot(a, aes(x=Species, y=Sepal.Length, fill=Species))+
geom_boxplot(notch=TRUE, fill="white")+
geom_dotplot(binaxis="y", binwidth=.1, stackdir="center", alpha=.7)

これもなかなかみやすくなりました。
ラベルを調整する
軸やラベルの文字を調整します。
themeでフォントサイズをそれぞれ変更する
作りたいfigureの大きさによって軸ラベルなどのフォントを変更します。
ggplot(a, aes(x=Species, y=Sepal.Length, fill=Species))+
  geom_boxplot(notch = TRUE, fill="white")+
  geom_dotplot(binaxis="y", binwidth=.1, stackdir = "center")+
  theme(axis.text.x = element_text(size = 16, face = "bold"),
        axis.text.y = element_text(size = 16),
        axis.title.x = element_text(size = 20),
        axis.title.y = element_text(size = 20),
        legend.title = element_text(size=16),
        legend.text = element_text(size=16))
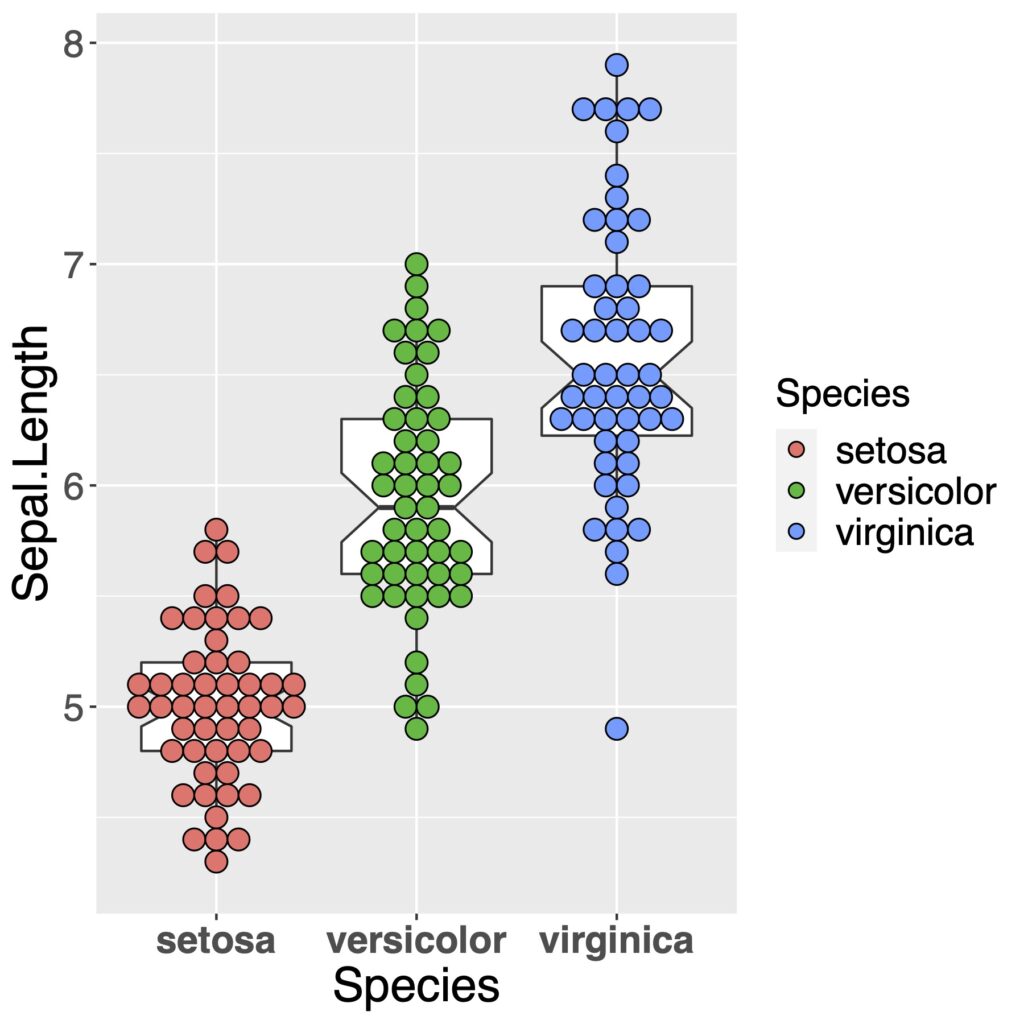
とてもみやすくなりました。文字の大きさなどは自分が出力したい大きさを確認しながら調整するのが便利です。
x軸ラベルの文字数が多いときは少し傾きをもたせることによって見やすくなります。
element_textのangleを設定してx軸側のラベルに傾きをもたせる
ggplot(a, aes(x=Species, y=Sepal.Length, fill=Species))+
  geom_boxplot(notch = TRUE, fill="white")+
  geom_dotplot(binaxis="y", binwidth=0.1, stackdir = "center")+
  theme(axis.text.x = element_text(angle = 50, vjust = 1, size = 16, hjust = 1, face = "bold"),
        axis.text.y = element_text(hjust = 1, size = 16),
        axis.title.x = element_text(size = 20),
        axis.title.y = element_text(size = 20),
        legend.title = element_text(size=16),
        legend.text = element_text(size=16))
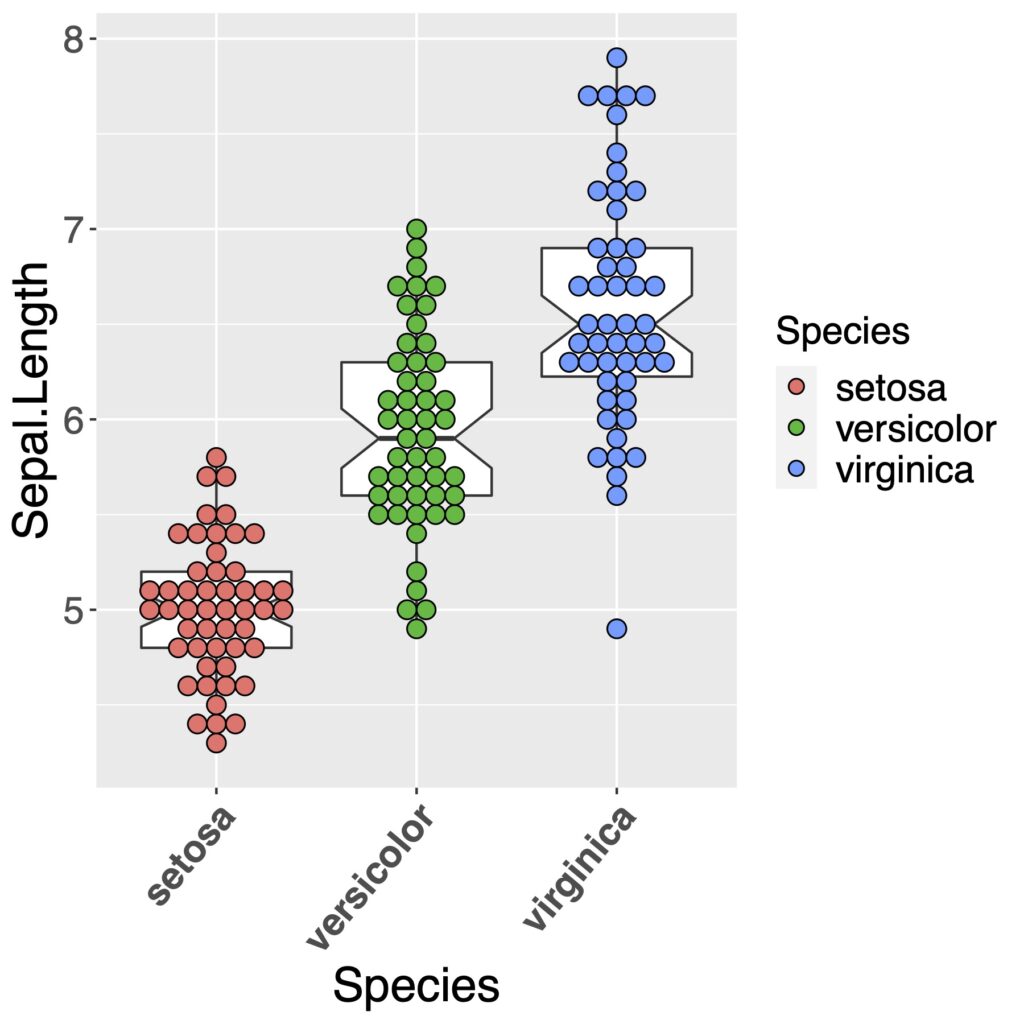
theme_classicで背景を消す
theme_classic()で片側だけ枠線がつきます。
ggplot(a, aes(x=Species, y=Sepal.Length, fill=Species))+
  geom_boxplot(notch = TRUE, fill="white")+
  geom_dotplot(binaxis="y", binwidth=0.1, stackdir = "center")+
  theme_classic()+
  theme(axis.text.x = element_text(angle = 50, vjust = 1, size = 16, hjust = 1, face = "bold"),
        axis.text.y = element_text(hjust = 1, size = 16),
        axis.title.x = element_text(size = 20),
        axis.title.y = element_text(size = 20),
        legend.title = element_text(size=16),
        legend.text = element_text(size=16))
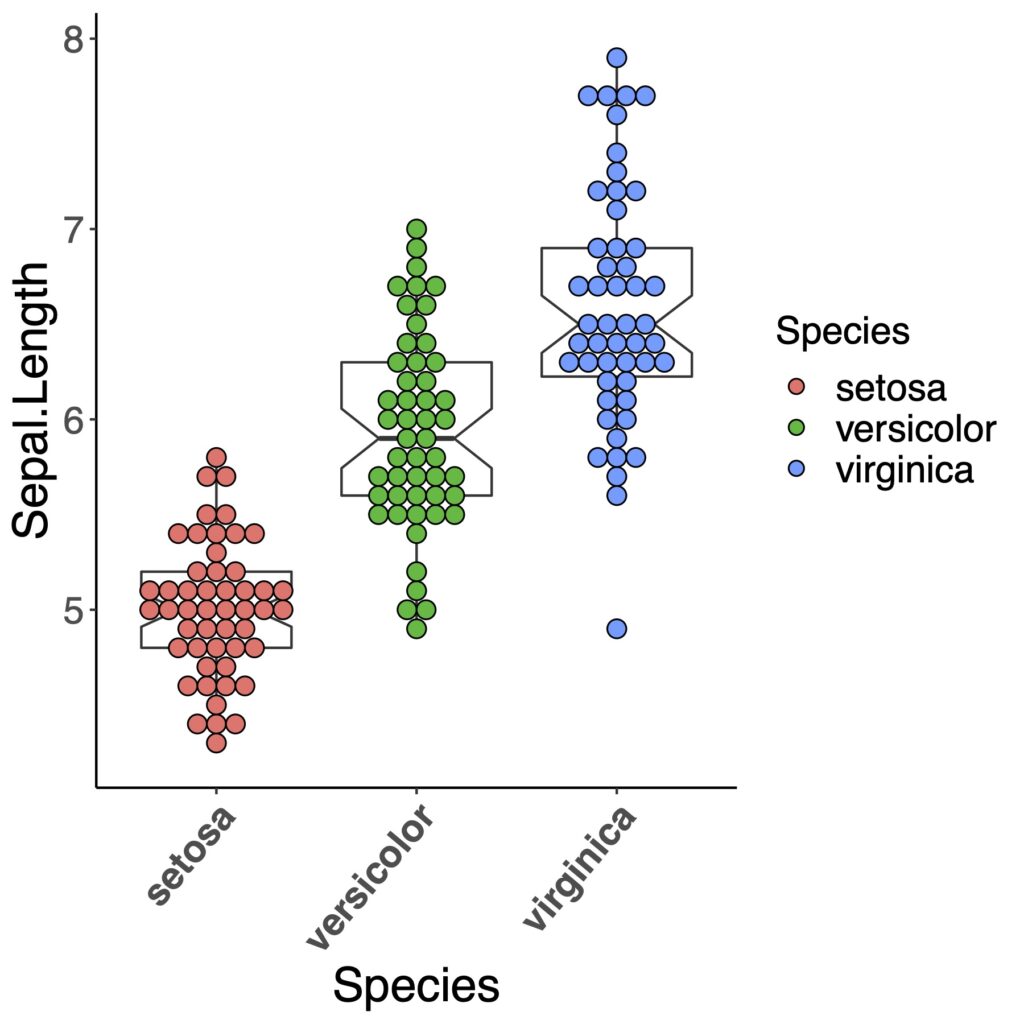
それらしい図ができました!ノッチはなくてもいいかもしれませんね。箱ひげ図の幅も少し変更しておきましょう。
ggplot(a, aes(x=Species, y=Sepal.Length, fill=Species))+
  geom_boxplot(width=0.9, notch = FALSE, fill="white")+
  geom_dotplot(binaxis="y", binwidth=0.1, stackdir = "center")+
  theme_classic()+
  theme(axis.text.x = element_text(angle = 50, vjust = 1, size = 16, hjust = 1, face = "bold"),
        axis.text.y = element_text(hjust = 1, size = 16),
        axis.title.x = element_text(size = 20),
        axis.title.y = element_text(size = 20),
        legend.title = element_text(size=16),
        legend.text = element_text(size=16))

これでデータの分布がよく分かるのではないでしょうか。
少し慣れた方向けにggbeeswarmを使った方法を別に紹介しています。
お役立ちいただけましたら幸いです。


