

There are several ways to visualize data, and one of them is the violin plot! This method is useful for comparing multiple sets of data, and it has an appealing appearance.
First, you’ll need to prepare your data. While you’re at it, you can also check the data distribution using a dot plot.
Data Generation and Distribution Checking
Now, let’s create some data. If you have your own data, feel free to use that instead.
# Set working directory
setwd("~/Rpractice/")
# load tidyverse and ggbeeswarm
library(tidyverse)
library(ggbeeswarm)
# generate sample data
dat <- list(
X <- rnorm(100, 5, 10),
Y <- rnorm(100, 20, 10),
Z <- rnorm(100, 15, 15)
)
# format the data into a more usable shape using pivot_longer
df <- data.frame(matrix(unlist(dat), nrow=100))
colnames(df) <- c("A","B","C")
df.long <- pivot_longer(df, cols = A:C, names_to = "Categories", values_to = "Values")
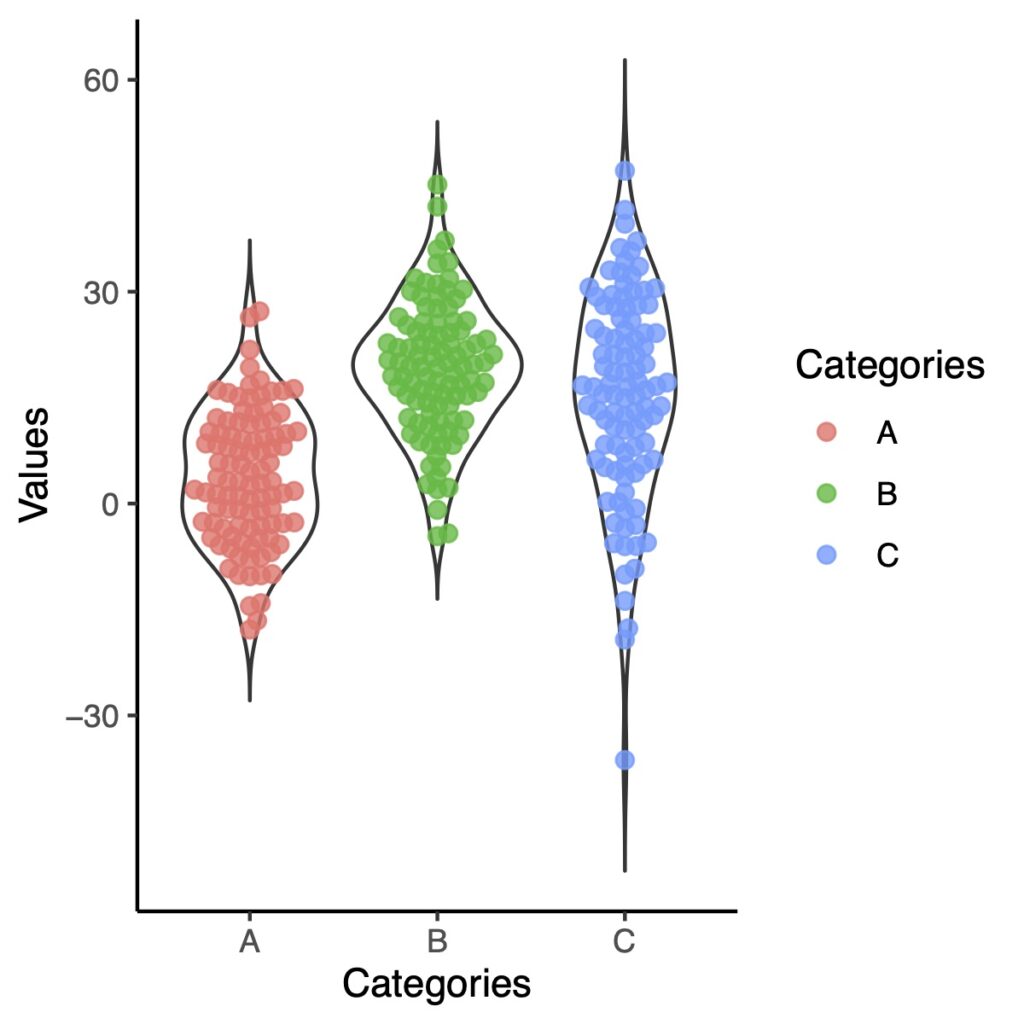
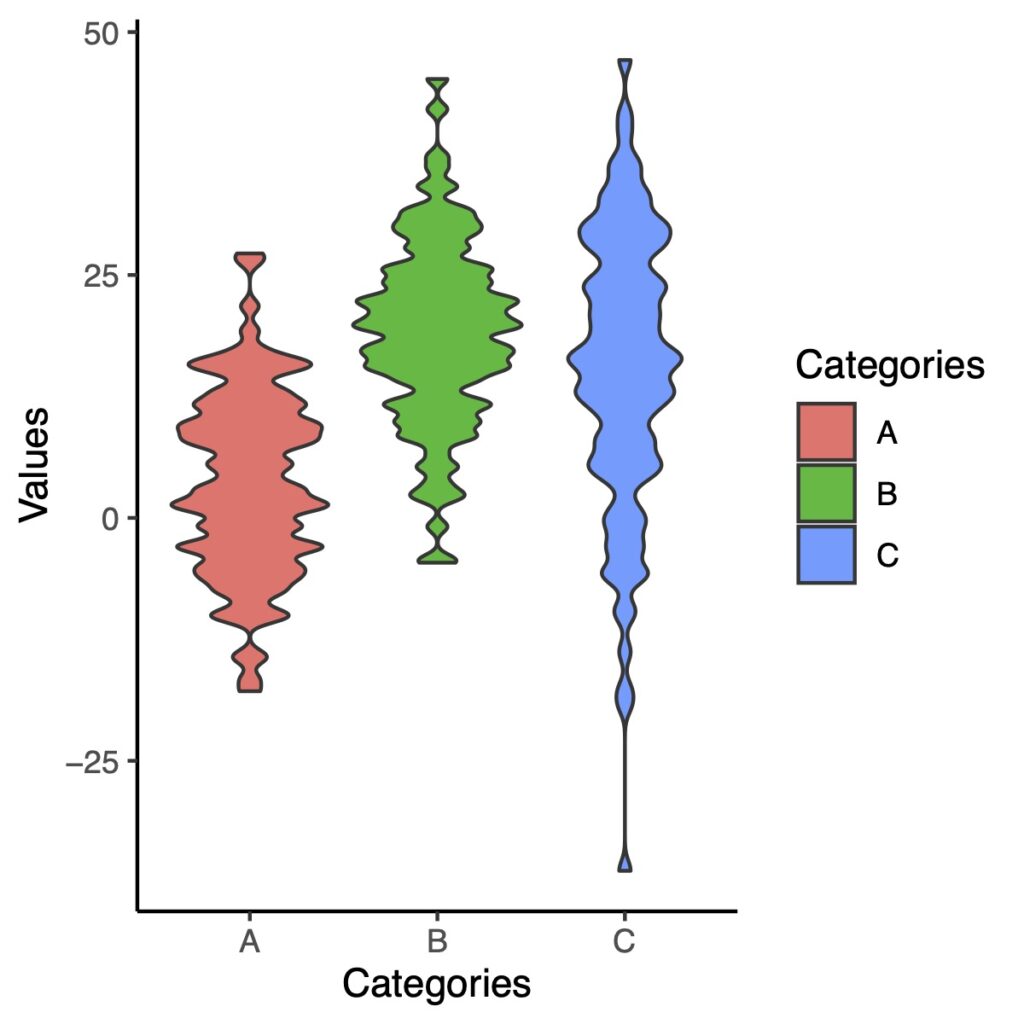
# draw dotplot
ggplot(df.long, aes(x = Categories, y = Values))+
geom_beeswarm(aes(color = Categories),
size = 2,
cex = 2,
alpha = .8)+
theme_classic()+
theme(legend.position = "none")
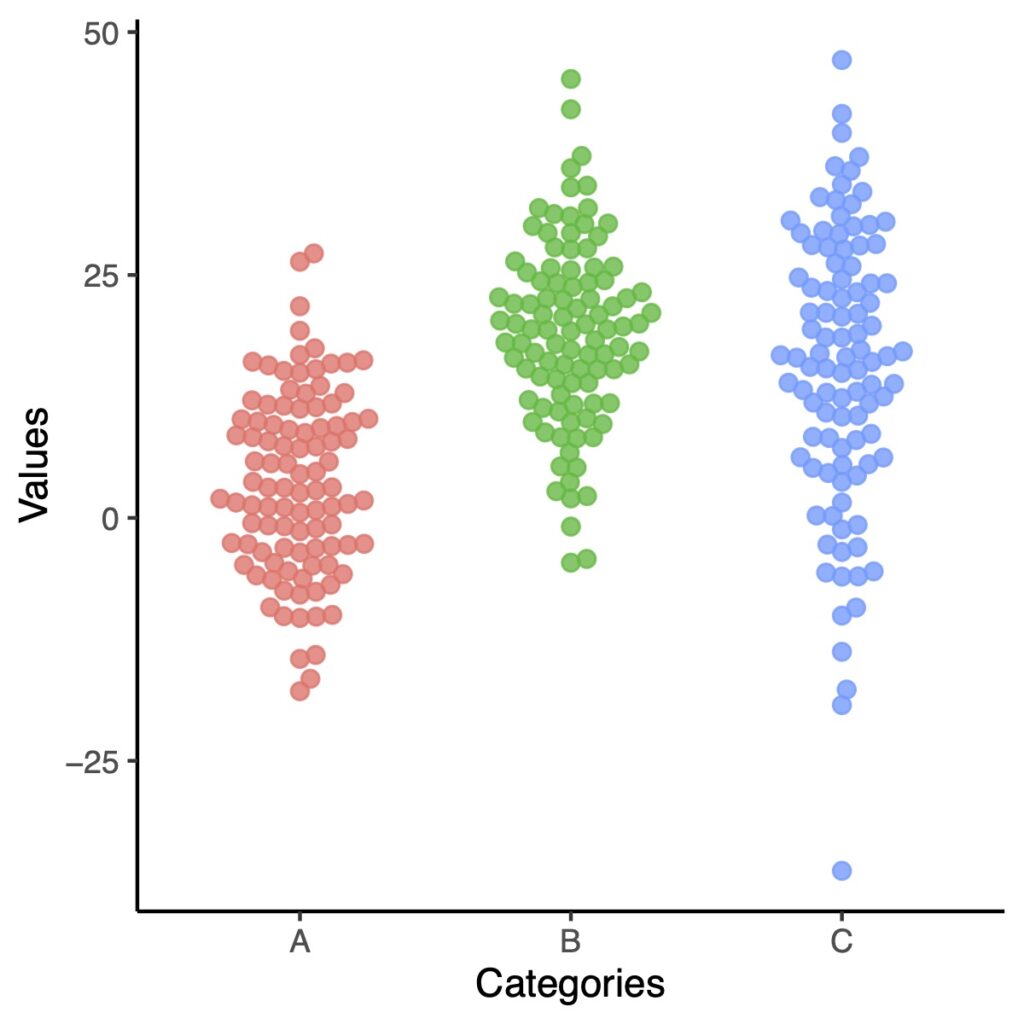
The dot plot displays the data distribution and can be used to confirm that the data is appropriate for creating a violin plot.
Draw a Simple Violin Plot
To draw a violin plot using ggplot2, you can utilize the geom_violin() function. To create a clean and simple plot, set the background color to white using the theme_classic() function.
ggplot(df.long, aes(x = Categories, y = Values))+
  geom_violin()+
  theme_classic()
The ends of the violin plot may appear cut off. By overlaying a dot plot on top of the violin plot, you can address this issue. To do so, you can use either geom_dotplot() or geom_beeswarm(), which are both part of the ggplot2 package.
ggplot(df.long, aes(x = Categories, y = Values))+
  geom_violin()+
  geom_beeswarm(aes(color = Categories),
                size = 2,
                cex = 2,
                alpha = .8)+
  theme_classic()
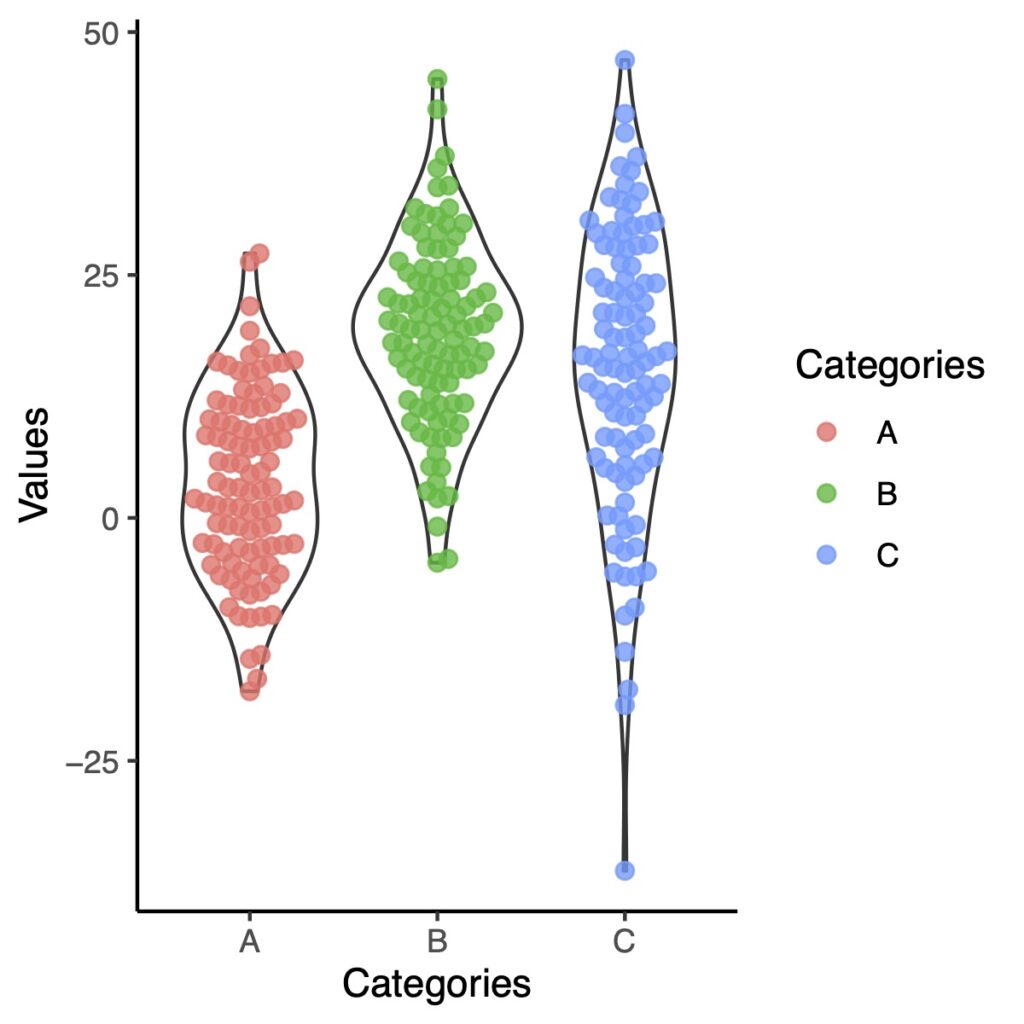
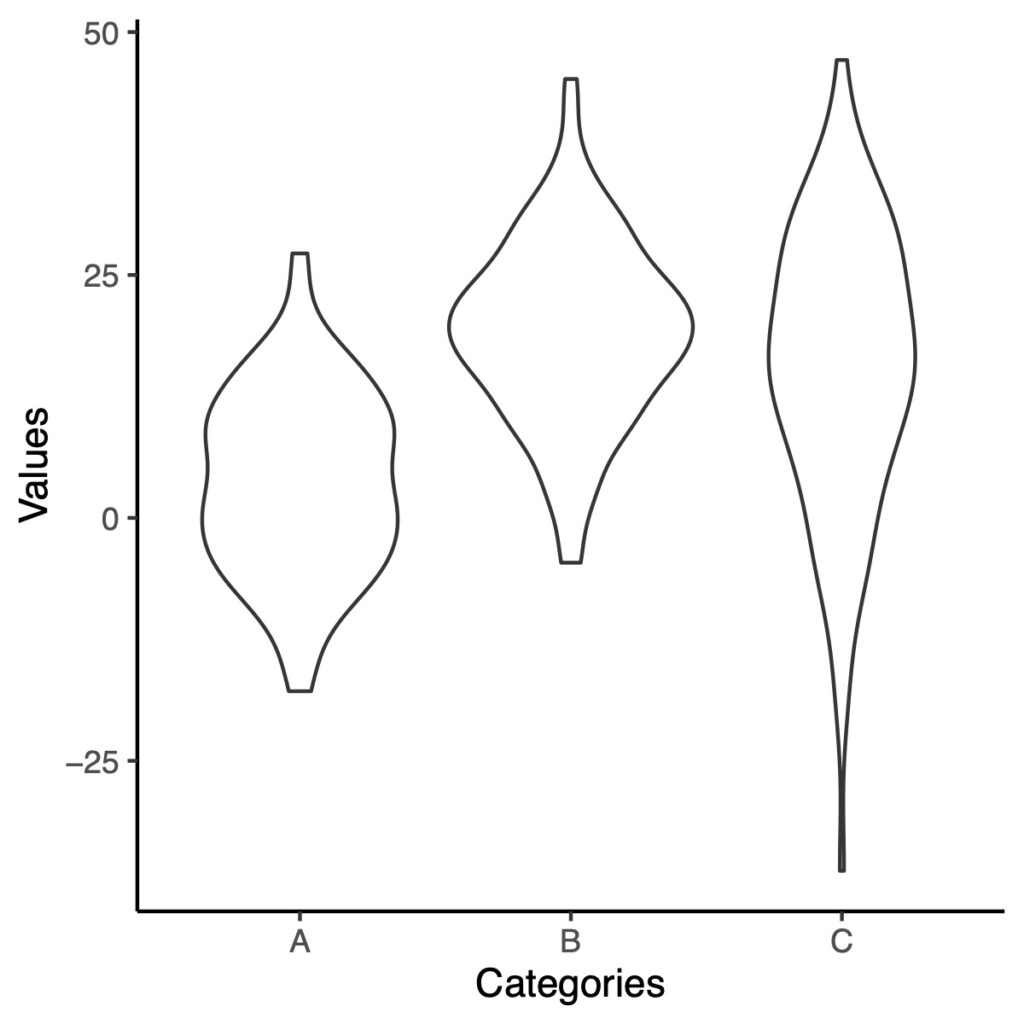
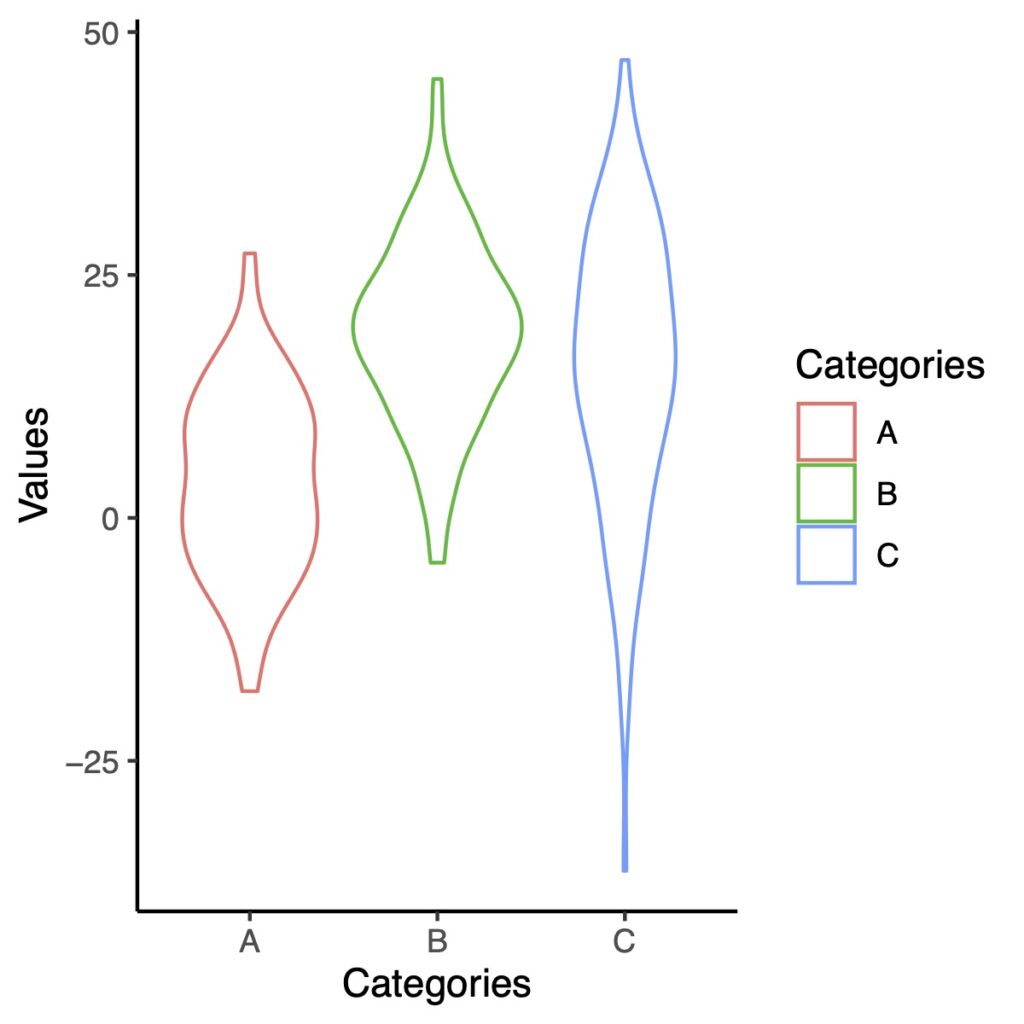
You can see that the ends of this violin plot are cut off at the minimum and maximum values. If you don’t want to cut off the ends, you can use geom_violin(trim = FALSE) to specify this preference.
ggplot(df.long, aes(x = Categories, y = Values))+
  geom_violin(trim = FALSE)+
  geom_beeswarm(aes(color = Categories),
                size = 2,
                cex = 2,
                alpha = .8)+
  theme_classic()
The violin plot may stretch vertically up and down, even in areas where there are no data points.
Add Color to Violin Plot
Add Color to the Borders
To add color to the border of the violin plot, you can use aes(color = ) inside the geom_violin() function.
ggplot(df.long, aes(x = Categories, y = Values, color = Categories))+
  geom_violin()+
  theme_classic()
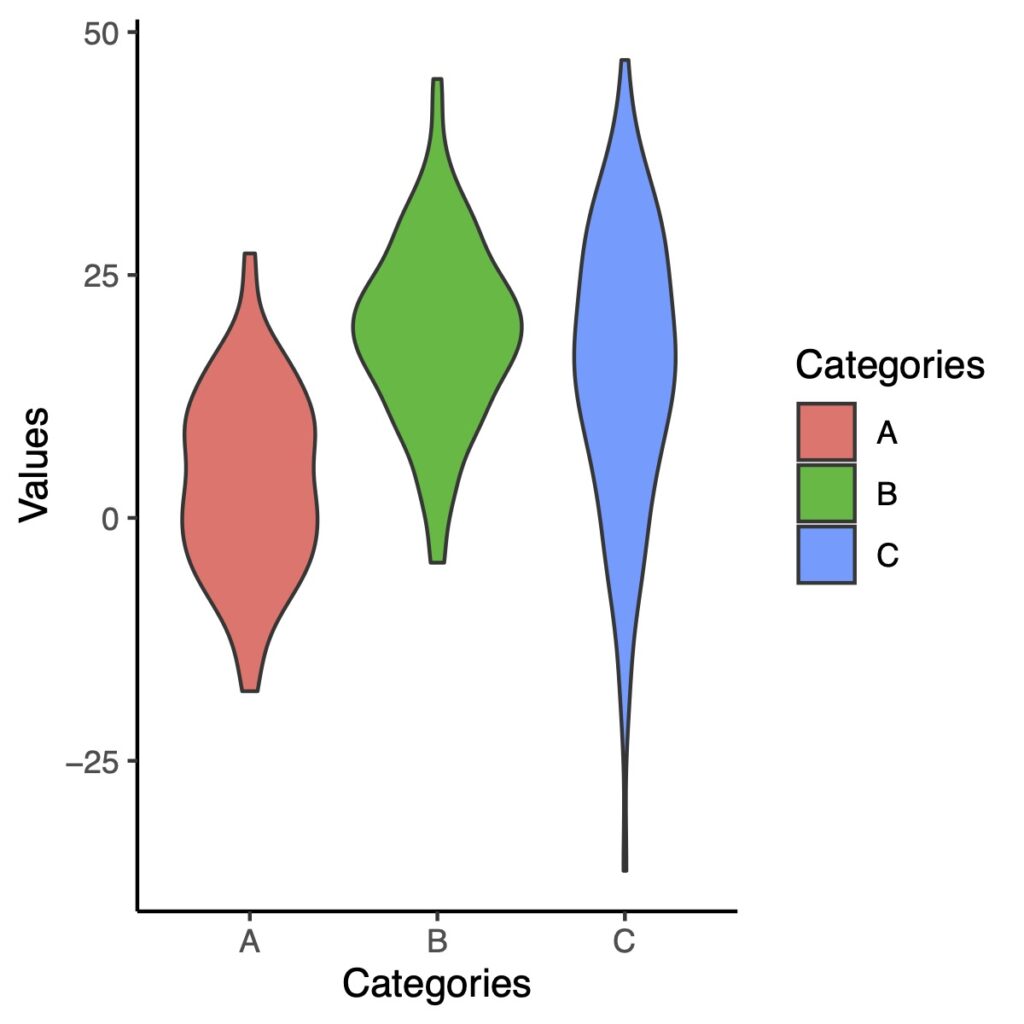
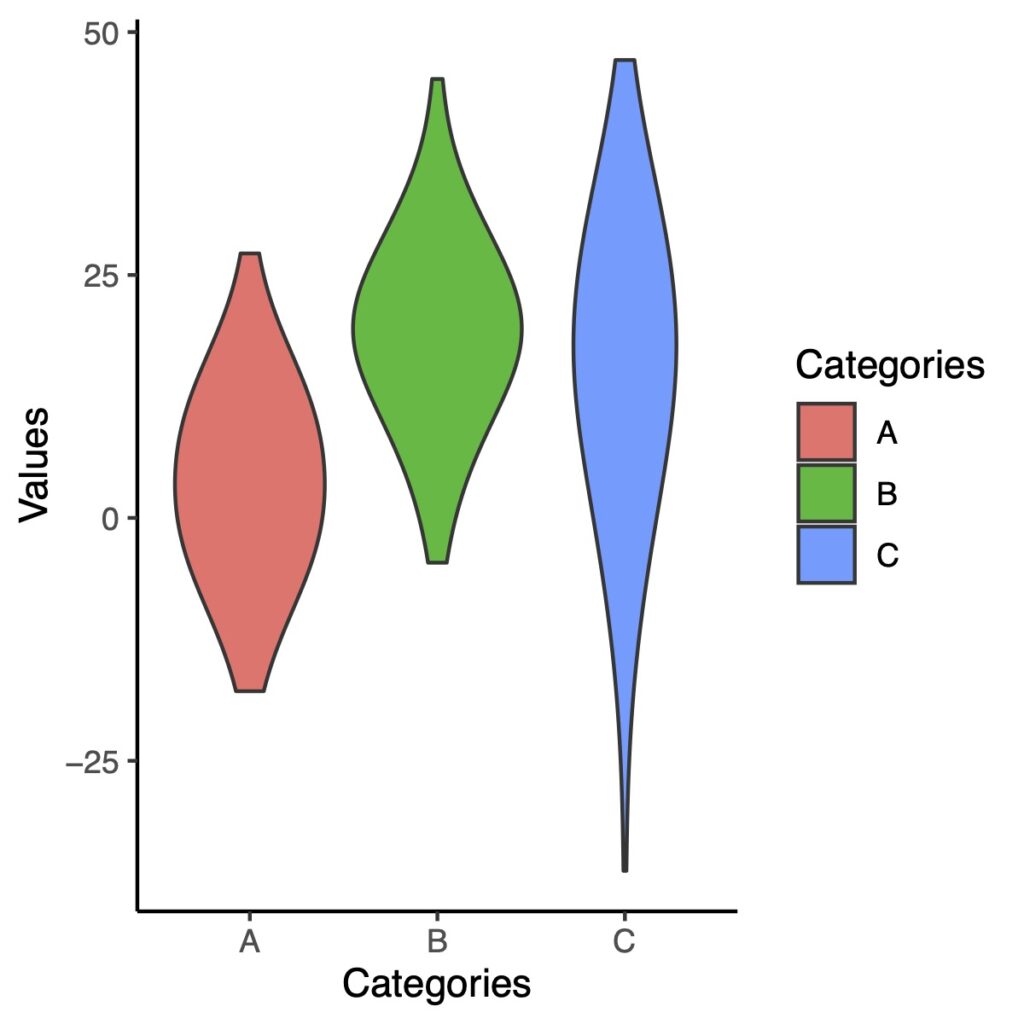
Fill the interior of Violin Plot
If you want to fill the interior of the violin plot with color, you can use aes(fill =) inside the geom_violin() function.
ggplot(df.long, aes(x = Categories, y = Values, fill = Categories))+
  geom_violin()+
  theme_classic()
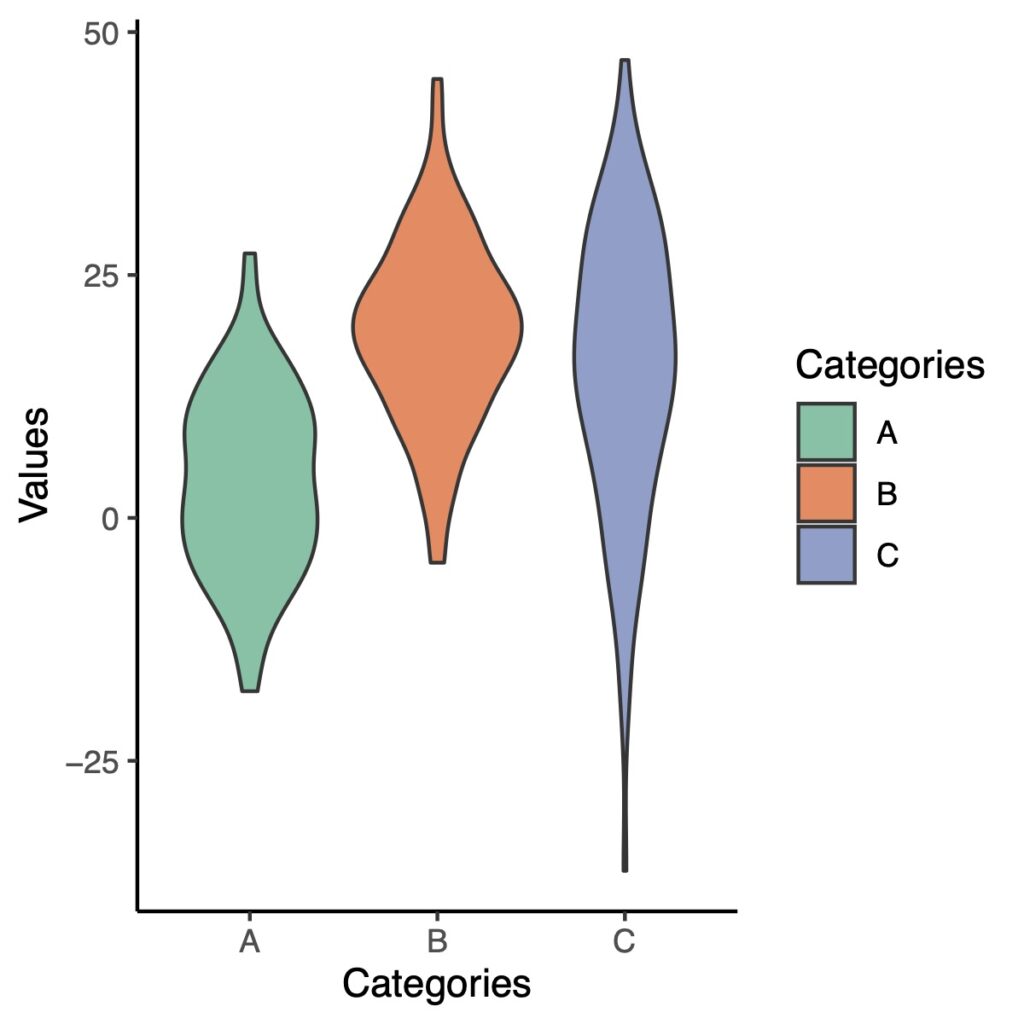
There are several ways to change the color of the violin plot. One way is to use the scale_fill_brewer() function to specify the color scheme.
ggplot(df.long, aes(x = Categories, y = Values, fill = Categories))+
  geom_violin()+
  scale_fill_brewer(palette = "Set2")+
  theme_classic()
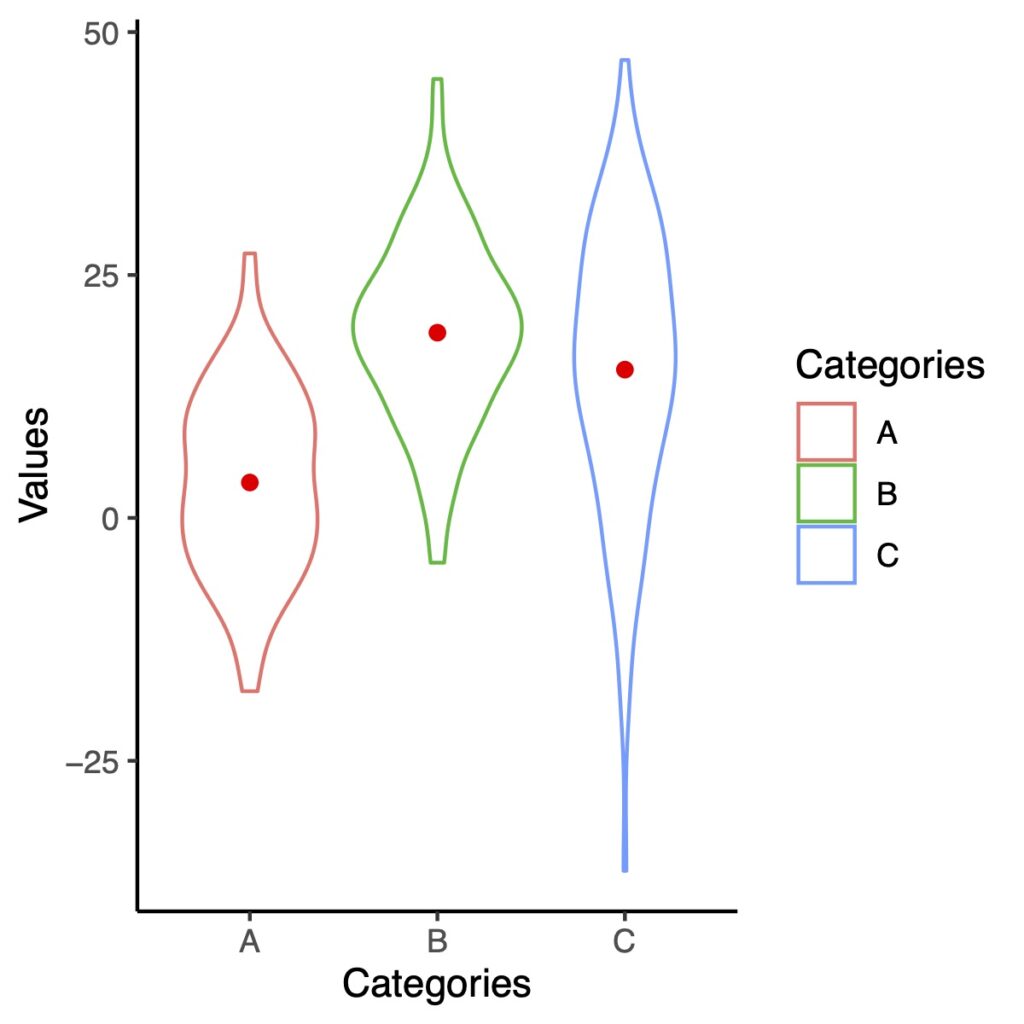
Add Mean or Median to the Violin Plot
To add the mean or median to the violin plot, you can use the stat_summary() function.
Add Mean
ggplot(df.long, aes(x = Categories, y = Values, color = Categories))+
  geom_violin()+
  stat_summary(fun = mean, geom = "point",
               shape = 16, size = 2, color = "red")+
  theme_classic()
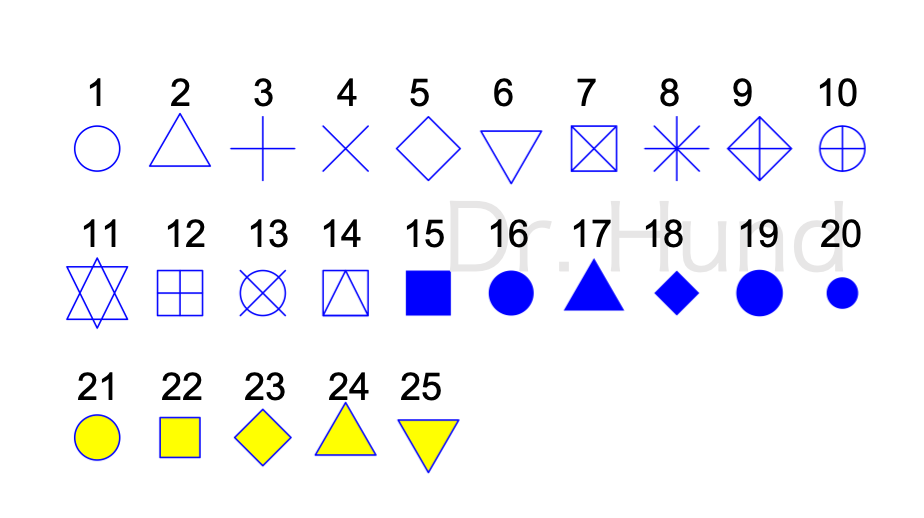
The shape parameter in stat_summary() is the same as pch in base R. Here’s a list of shapes that correspond to each numerical value:
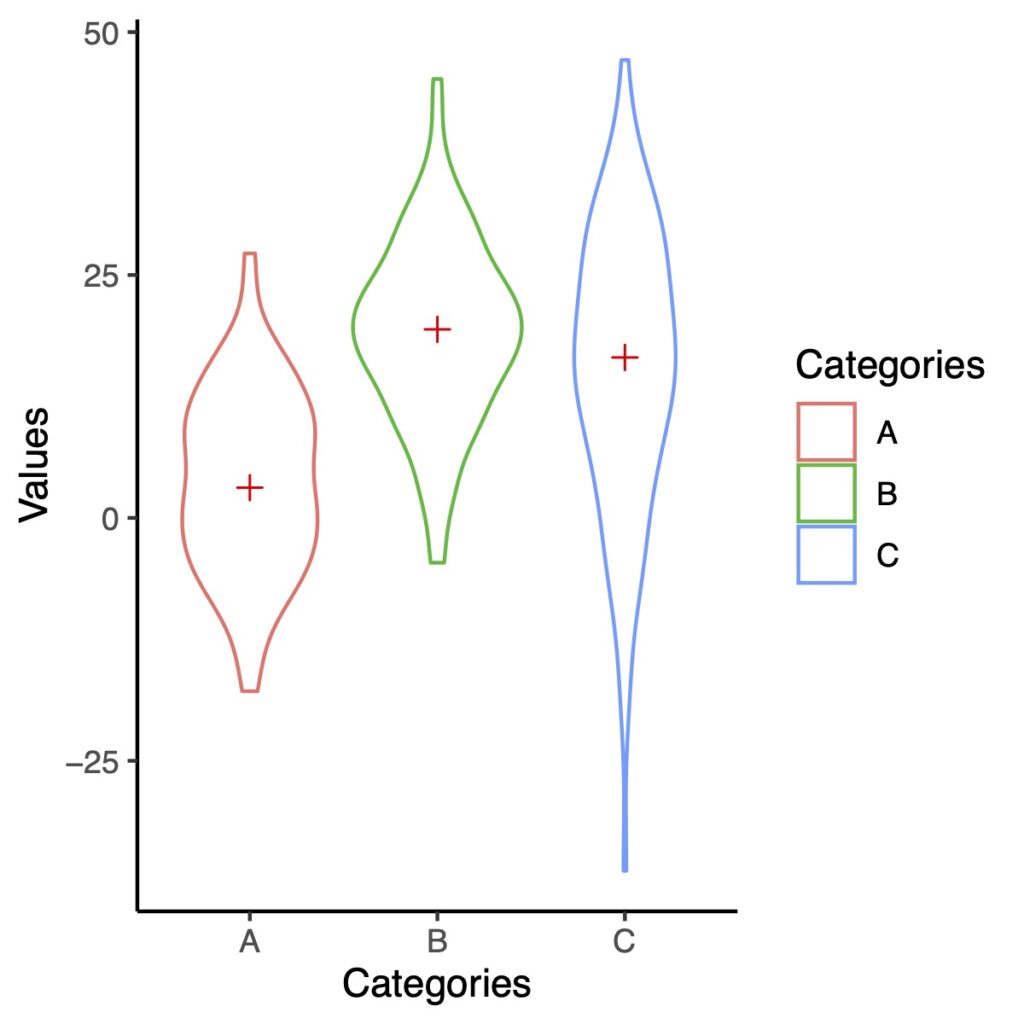
Add Median
ggplot(df.long, aes(x = Categories, y = Values, color = Categories))+
  geom_violin()+
  stat_summary(fun = median, geom = "point",
               shape = 3, size = 2, color = "red")+
  theme_classic()
Change the Degree of Smoothing
To change the degree of smoothing in the violin plot, you can use the adjust parameter inside the geom_violin() function. The default value for adjust is 1.
To decrease the degree of smoothing, you can set adjust to a smaller value. For example, to set adjust to 0.2, you can use the following code:
ggplot(df.long, aes(x = Categories, y = Values, fill = Categories))+
  geom_violin(adjust = .2)+
  theme_classic()
Conversely, if you want to increase the degree of smoothing in the violin plot, you can set the adjust parameter to a larger value.
ggplot(df.long, aes(x = Categories, y = Values, fill = Categories))+
  geom_violin(adjust = 2)+
  theme_classic()
If you increase the degree of smoothing too much, the violin plot can become overly smoothed and lose important details.
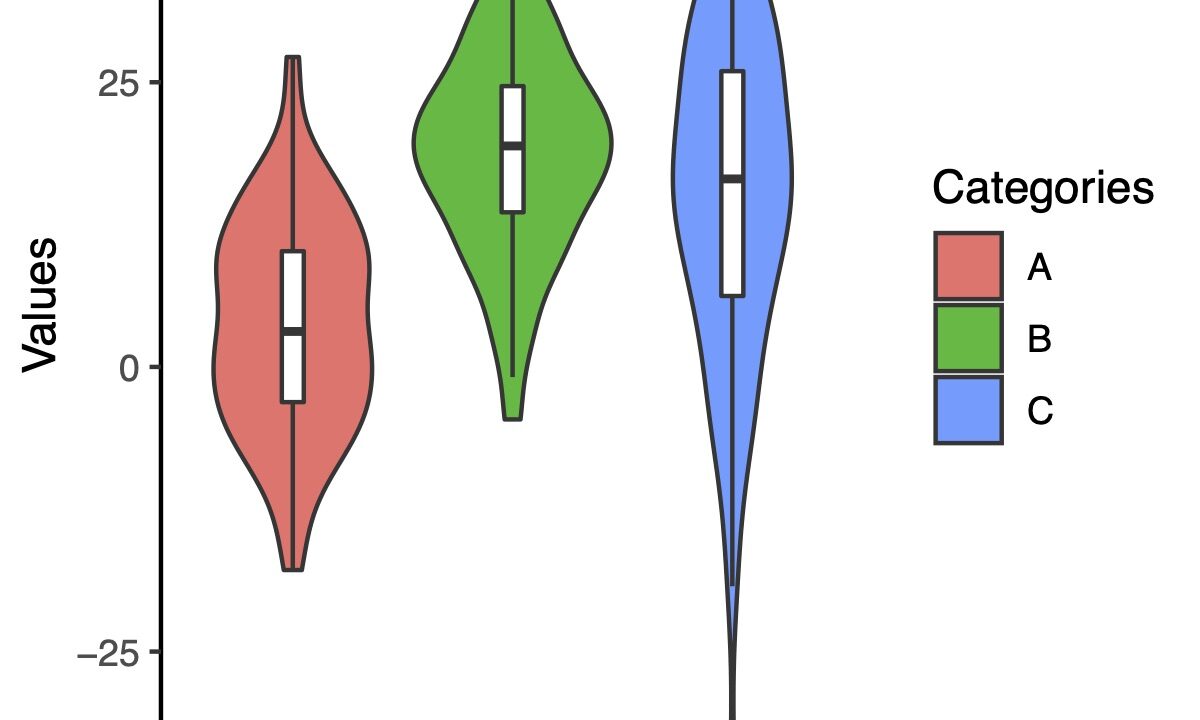
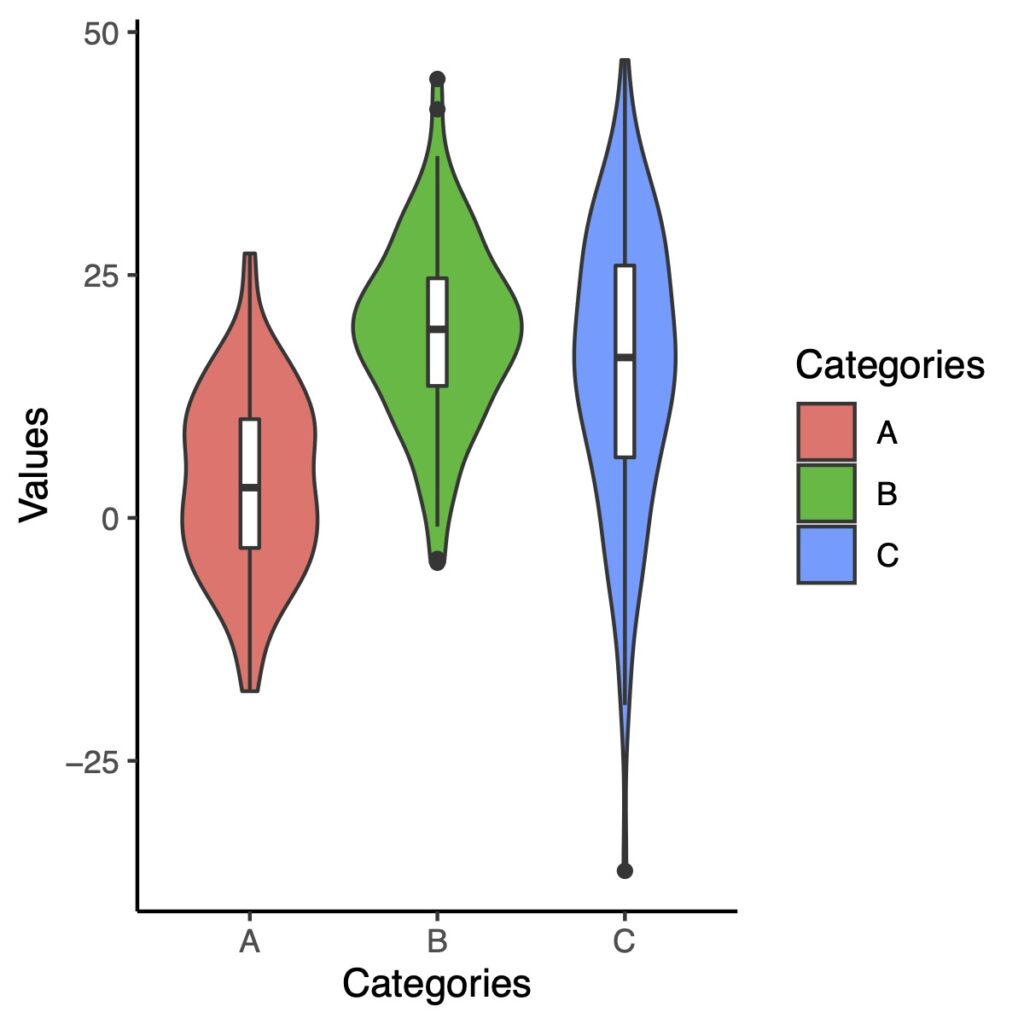
Overlaying a Box Plot
Overlaying a violin plot with a box plot is a common technique in data visualization, and it can be a powerful way to display data.
ggplot(df.long, aes(x = Categories, y = Values, fill = Categories))+
  geom_violin()+
  geom_boxplot(width = .1, fill = "white")+
  theme_classic()
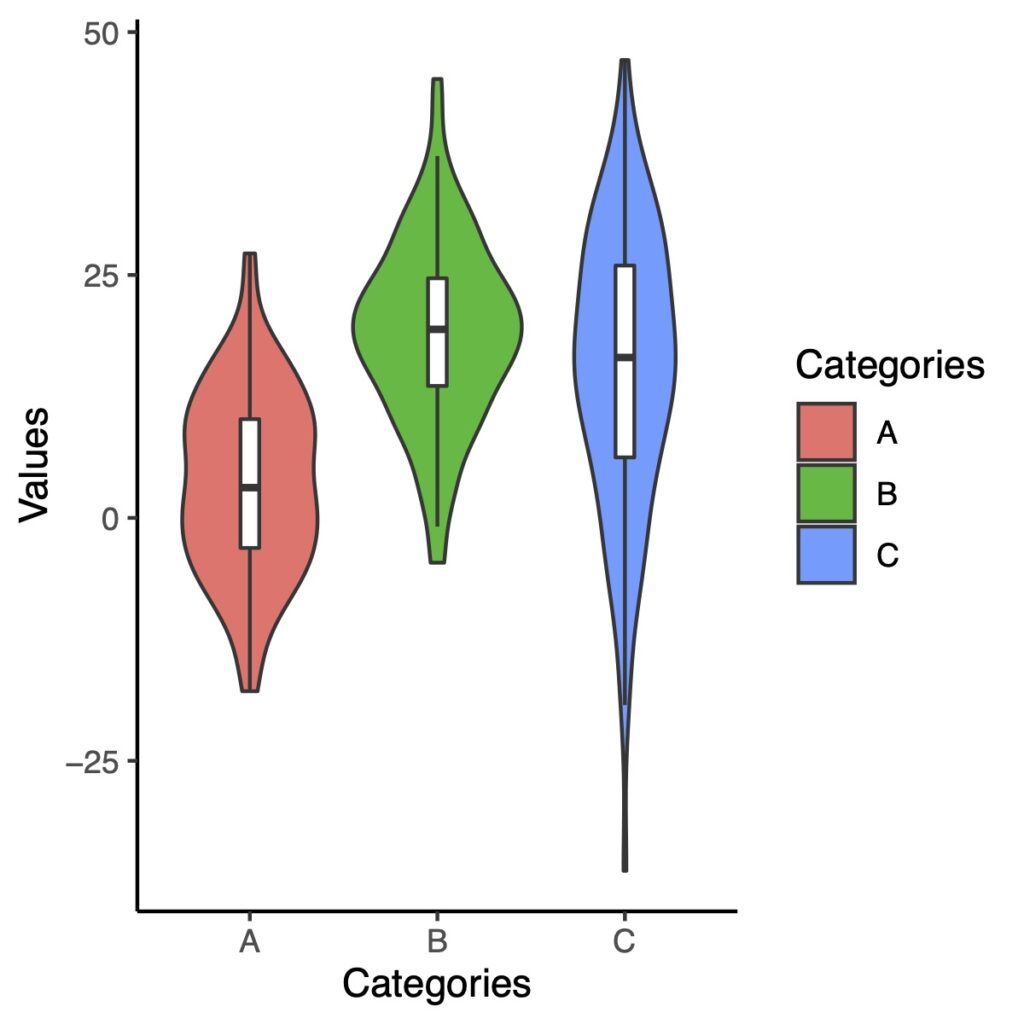
To hide the outliers in the box plot when overlaying it with a violin plot, you can use the outlier.color parameter inside the geom_boxplot() function.
ggplot(df.long, aes(x = Categories, y = Values, fill = Categories))+
  geom_violin()+
  geom_boxplot(width = .1, fill = "white", outlier.color = NA)+
  theme_classic()
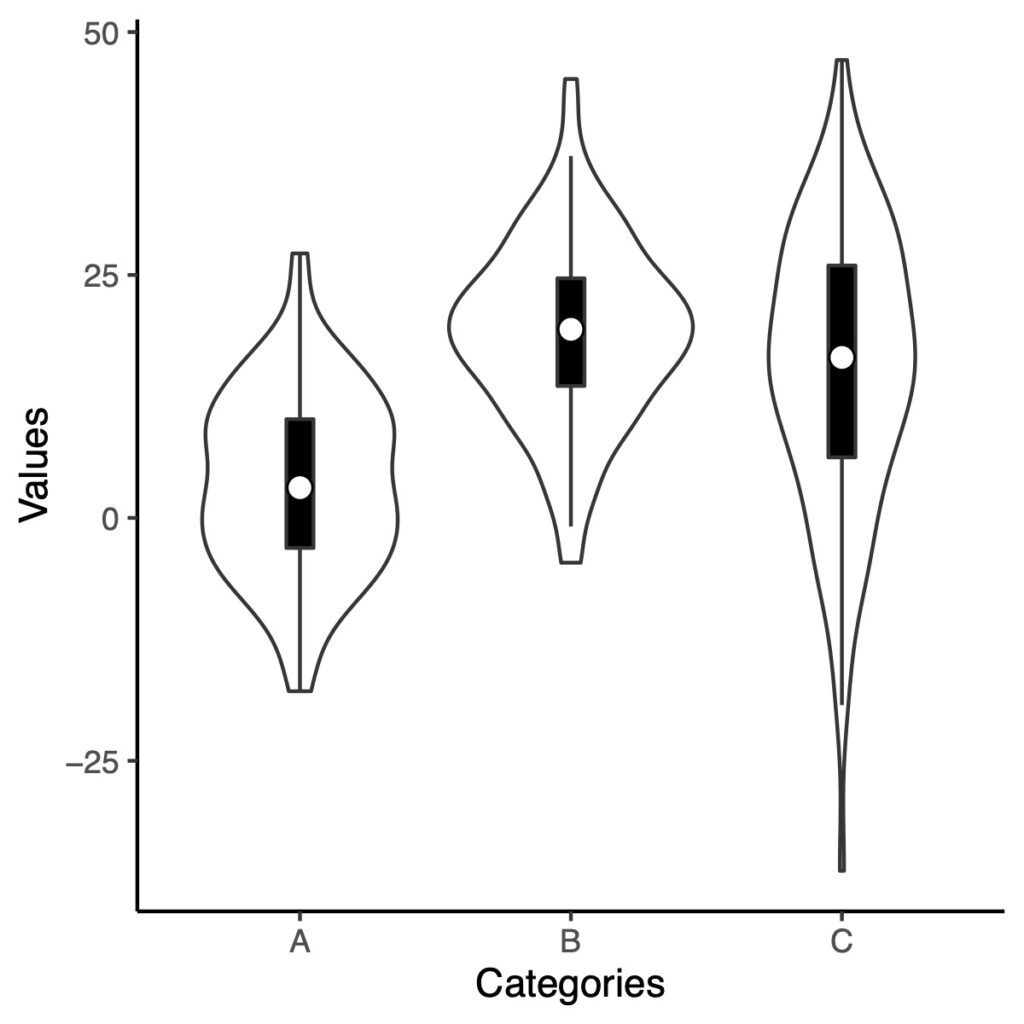
You can fill the box plot with black color and add a white circle at the median value.
ggplot(df.long, aes(x = Categories, y = Values))+
  geom_violin()+
  geom_boxplot(width = .1, fill = "black", outlier.color = NA) +
  stat_summary(fun = median, geom = "point", fill = "white", shape = 21, size = 3) +
  theme_classic()
With the information provided, I believe you can now create a violin plot. I hope this guidance proves helpful!